 L'hypercube
🌡️ Temperature trends and anomalies
A temperature observation tells us little when considered on its own. Is it typical for the season? Unusual for that city? Is it part of a particularly warm year or a longer-term trend?
To make this context easier to explore, L’hypercube has developed an interactive application that places daily temperatures within their climate history.
🔗 Explore the application
▶️ Open the Temperature trends and anomalies application
📊 What the tool provides
The application can be used to:
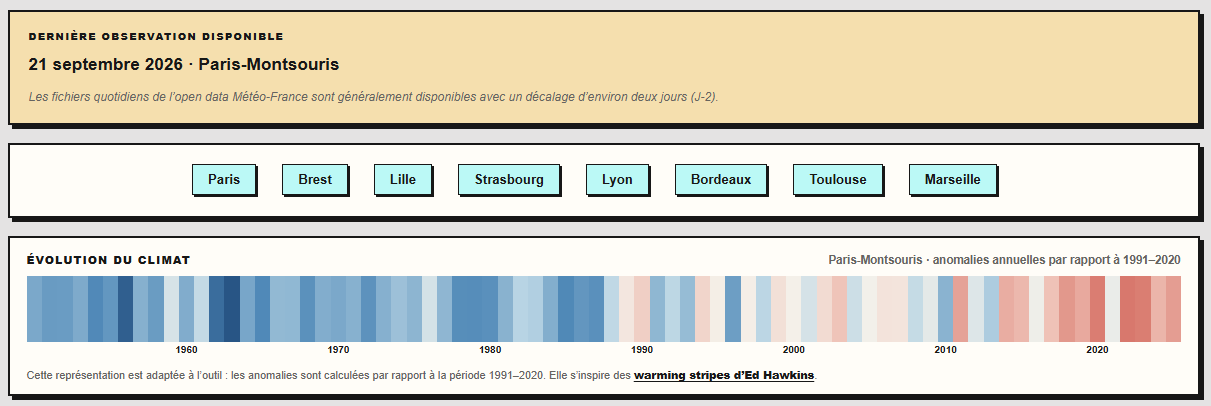
- choose from eight French cities;
- browse each station’s climate stripes to visualise annual trends;
- select a year and follow its daily temperatures;
- display anomalies relative to the 1991–2020 climate normal;
- compare the selected year with the station’s historical record and usual variability.
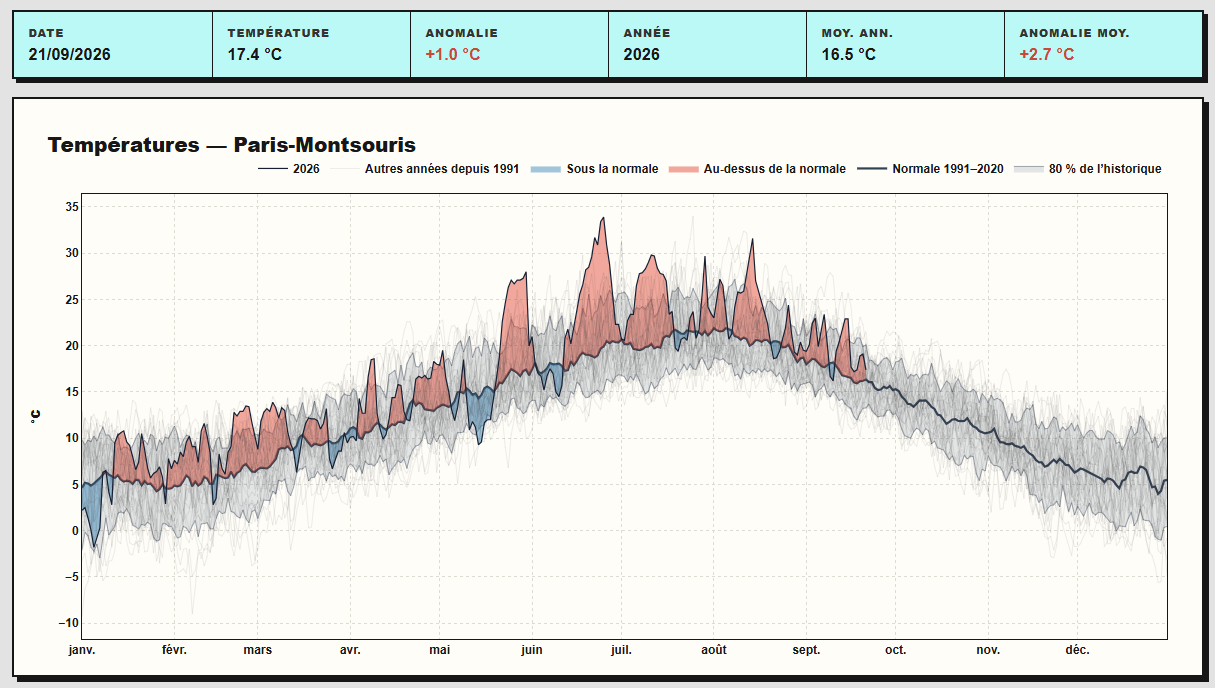
The climate stripes are inspired by Ed Hawkins’ warming stripes . Observations come from the open Données climatologiques de base quotidiennes dataset published by Météo-France.
📖 Find out more
The detailed tool page explains the data sources, the 1991–2020 normal, the two levels of interpretation, and the tool’s limitations.
For more on the relationship between weather observations and long-term trends, see our From weather to observed climate page.