💡 Using data for energy management
Since 2021, our teams from L’hypercube, Environment, and HVAC within the engineering division of AREP have been working together to develop, on behalf of the Executive Department of Regional and Parisian Stations (DGRP) of SNCF Gares & Connexions , expertise in data analysis related to energy consumption through our CONSEO tool.
Objectives of the Analyses
The main objectives of these analyses are to:
- Identify energy management anomalies, particularly those related to outdoor lighting.
- Optimize electricity subscriptions according to the TURPE and reduce subscription costs.
An approach focused on outdoor lighting
At the origin of these studies, a global reflection was carried out regarding the representation of consumption in stations, based on energy consumption data from suppliers. This project benefited from the availability of data on various energy management portals.
Access to these data allowed us to quickly test our methods on a large number of stations.
An Effective Representation of Load Curves: Heatmaps
The use of heatmaps became a natural choice.
The data used come from remotely read meters, providing information on the average power demand every 10, 30, or 60 minutes, depending on the equipment.
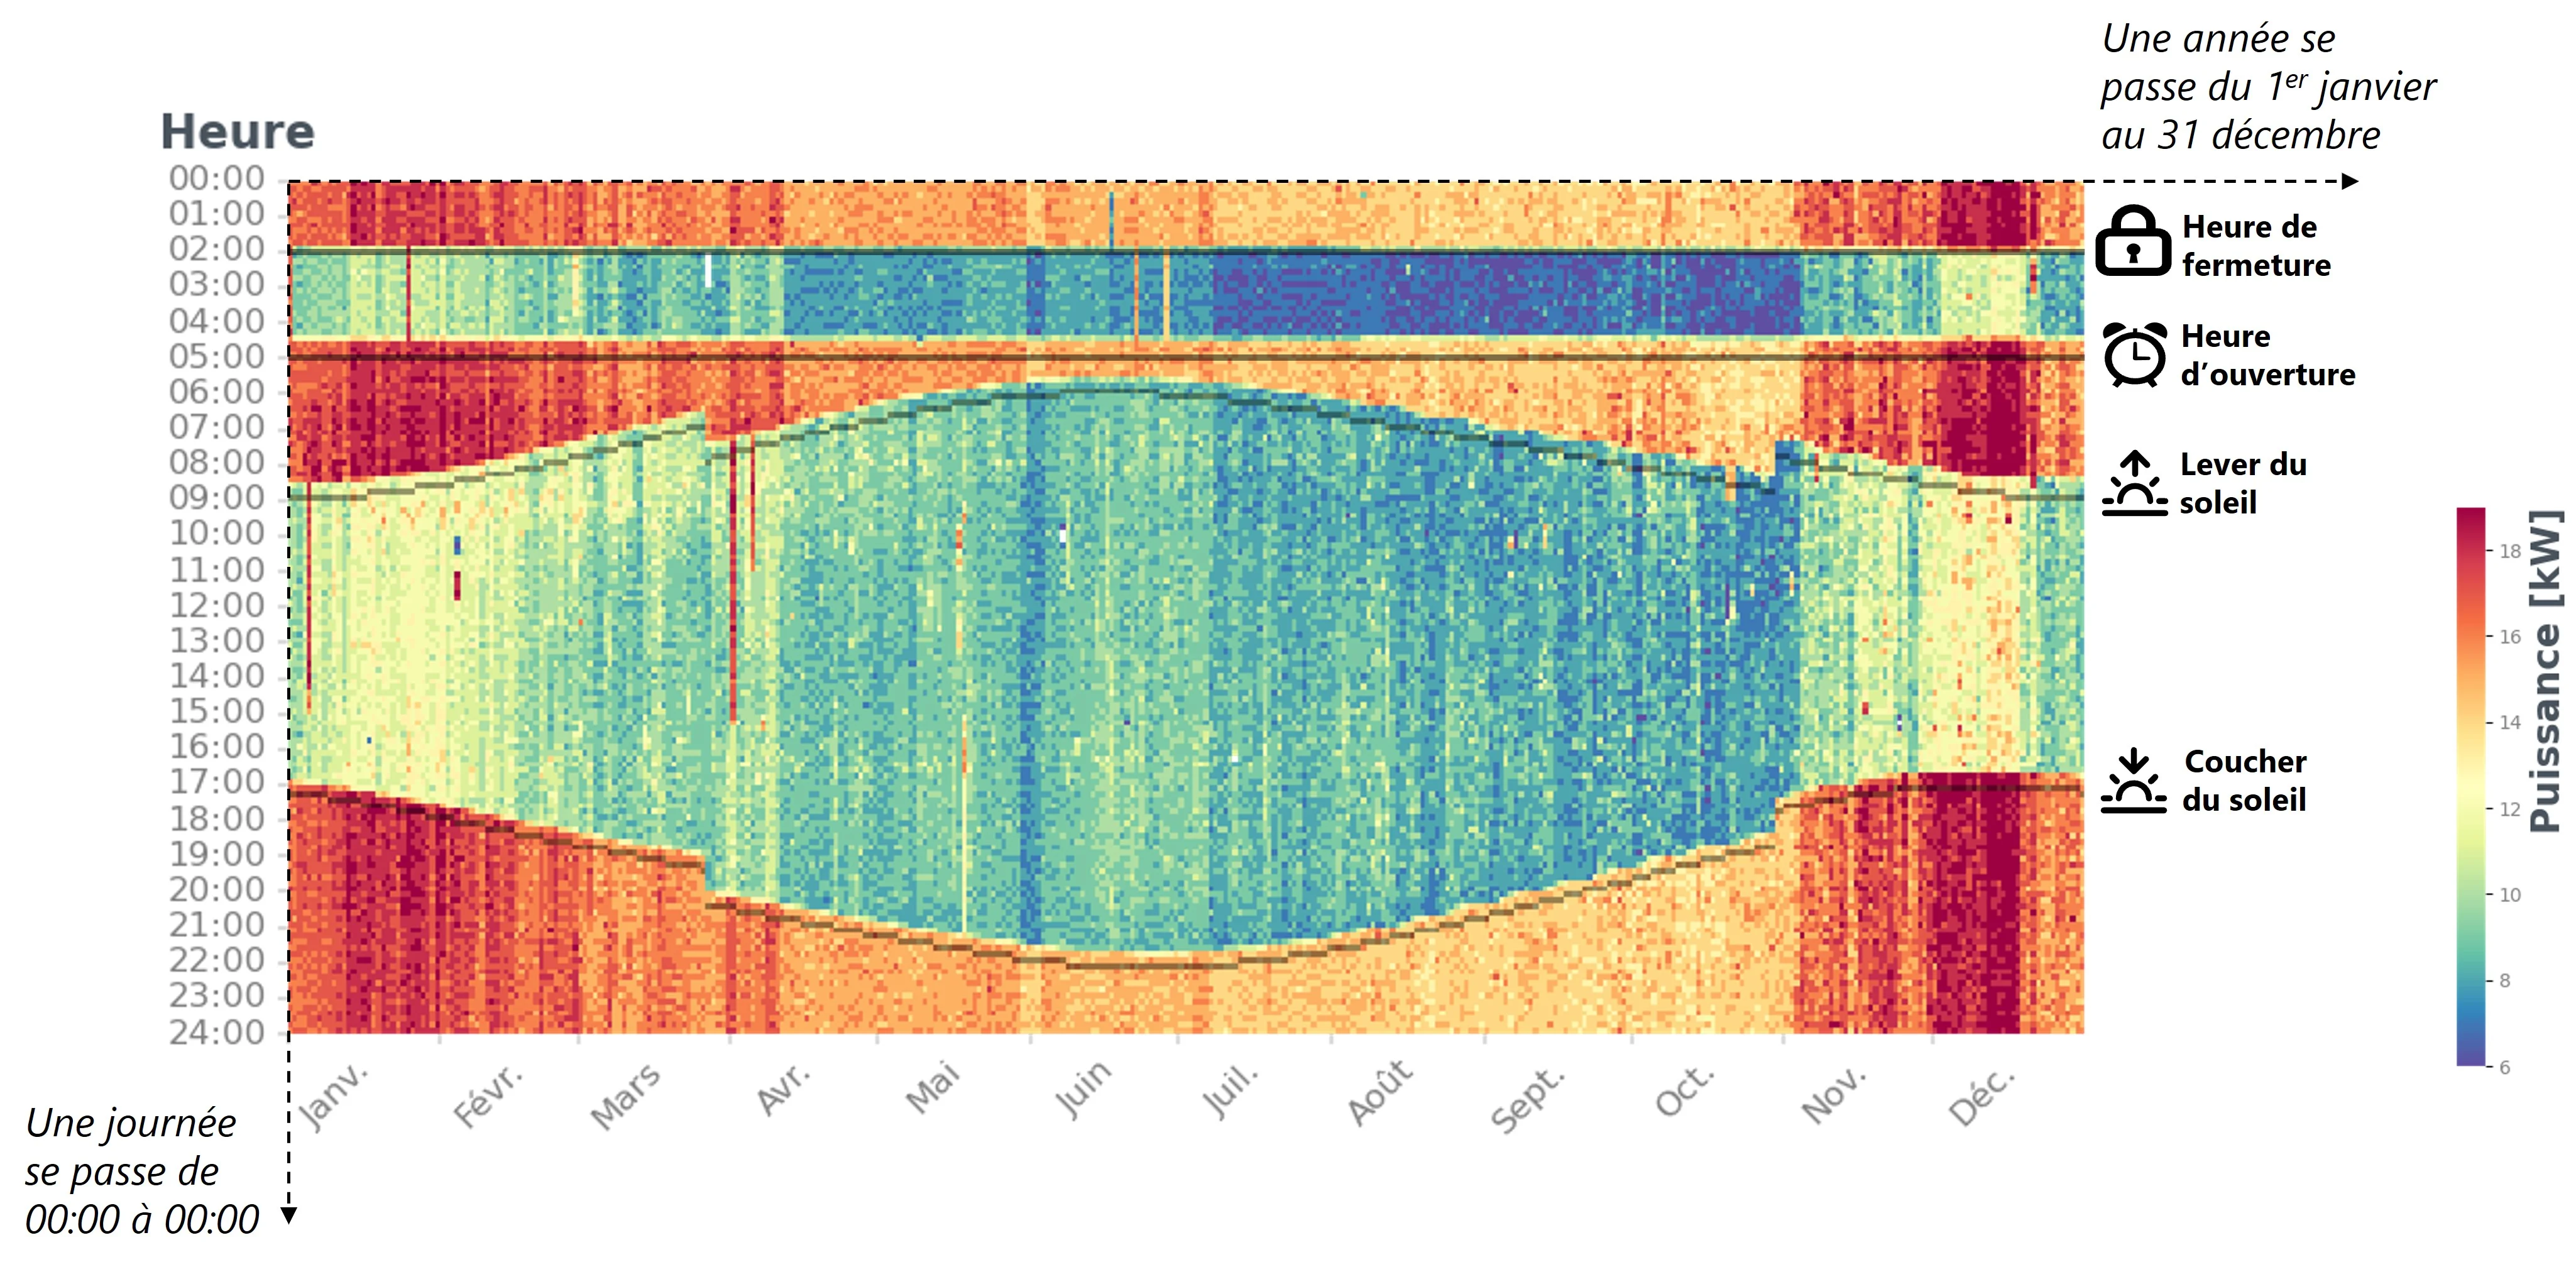
Example of a Heatmap

On this visualization:
- Each pixel represents the average power demand over 10 minutes, for each 10-minute interval of the year.
- From left to right: day-by-day progression over the year.
- From bottom to top: progression within the same day, in 10-minute slots.
- From blue to red: the value of the power demand increases (blue = low power and red = high power)
You can observe:
- A programmed shutdown of outdoor lighting according to sunrise and sunset times.
- A significant drop in consumption between 2:00 a.m. and 4:30 a.m., linked to the station being closed (in this example, 92% of this drop is due to outdoor lighting).
Identifying Anomalies at Scale
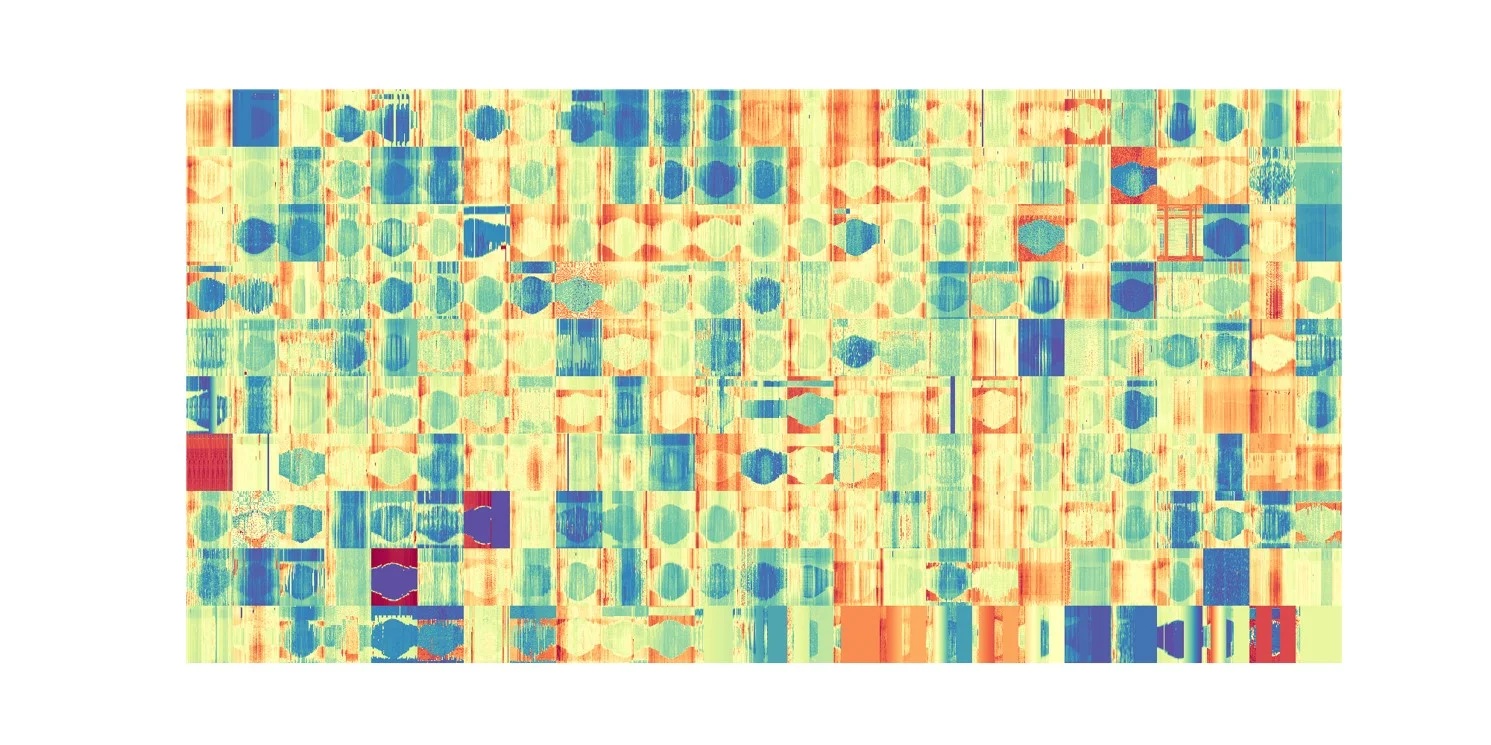
SNCF’s activity is complex due to the coexistence of multiple entities. However, visual analysis allows, in most cases, to quickly identify operational anomalies, such as abnormal shutdowns or outdoor lighting being on during the day.
Results

After an initial mission on 10 stations, the analysis was extended to 240 major French stations, which allowed:
- To identify more than 185 theoretical drifts,
- Representing a potential of 2.2 GWh/year in energy savings, to be compared with real-world implementation.

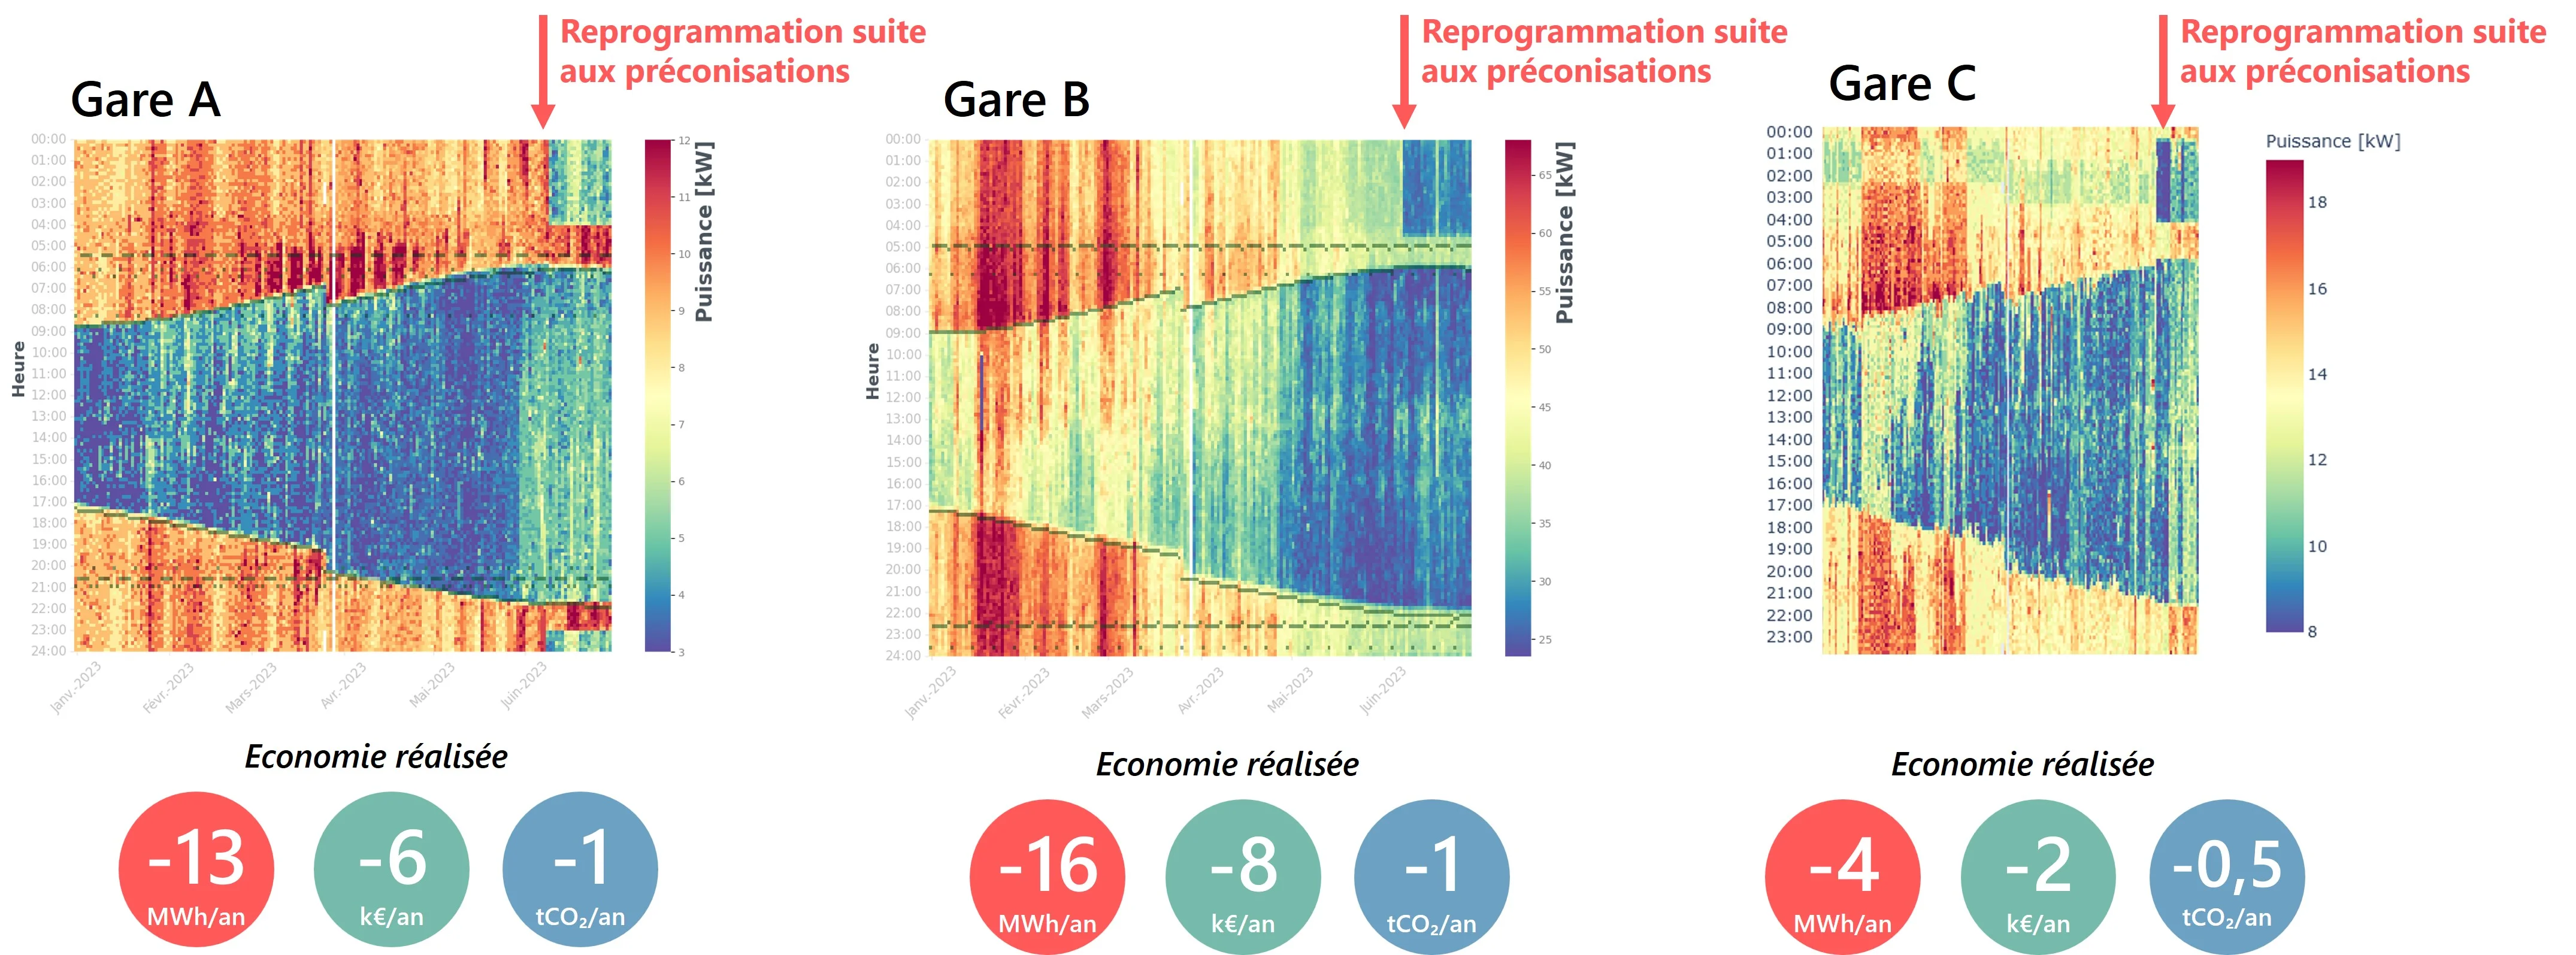
Some stations had their settings adjusted according to our recommendations: nighttime shutdown, reprogramming according to opening hours, etc.
A Dedicated Platform for SNCF Gares & Connexions
To facilitate the generalization of this approach, we developed a dedicated web platform allowing SNCF Gares & Connexions to:
- Conduct analyses autonomously,
- Monitor the implementation of recommendations.
Perspectives
Two avenues for further development are currently underway:
- Supervision of other systems, such as heating or air conditioning.
- Extension to other SNCF buildings, such as technicentres.