
#Climate #Comfort
💾 Download the description in PDF
Certain draughts induced by the built environment can be a genuine source of discomfort, both indoors and outdoors. These complex phenomena can only be appreciated by using state-of-the-art numerical simulations, and the use of a suitable comfort index . These spatial studies can highlight local phenomena on a small and large scale
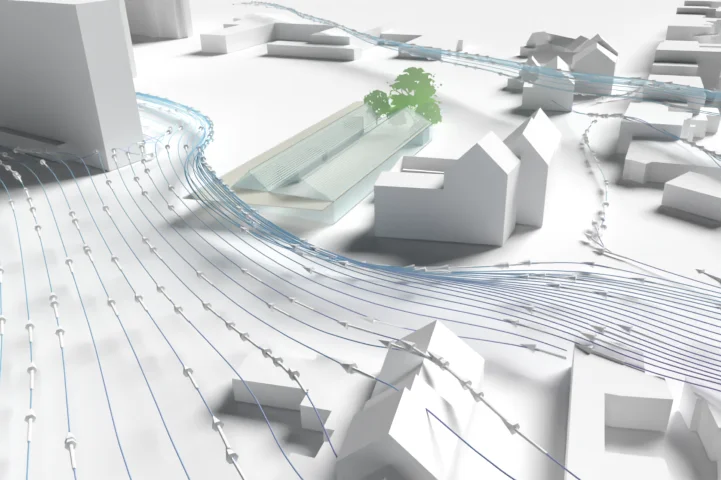
Urban air flows
Our Expertise
Our approach is based on a digital wind tunnel model providing the air velocity fields necessary for the airflow study of the project. The results are translated into wind comfort levels using statistical processing. For a representative year, a given level of activity level and following the CSTB methodology , the model associates the frequencies at which the annoyance threshold is exceeded with an acceptability scale.
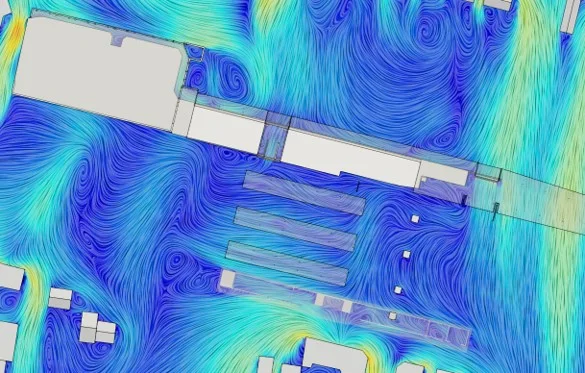
Mapping local wind velocities
Our Services
- Analysis of urban air flows:
- Calculation and mapping of local air velocities over a representative year,
- Assessment of the effects of the presence of protective devices and/or vegetation on local air velocities,
- Analysis of the impact of air circulation on comfort:
- Calculation and mapping of wind comfort levels,
- Assessment of the risks of discomfort in the wind as a result of different activities and climatic scenarios,
- Architectural or Urban design assistance by recommending preventive and corrective solutions.
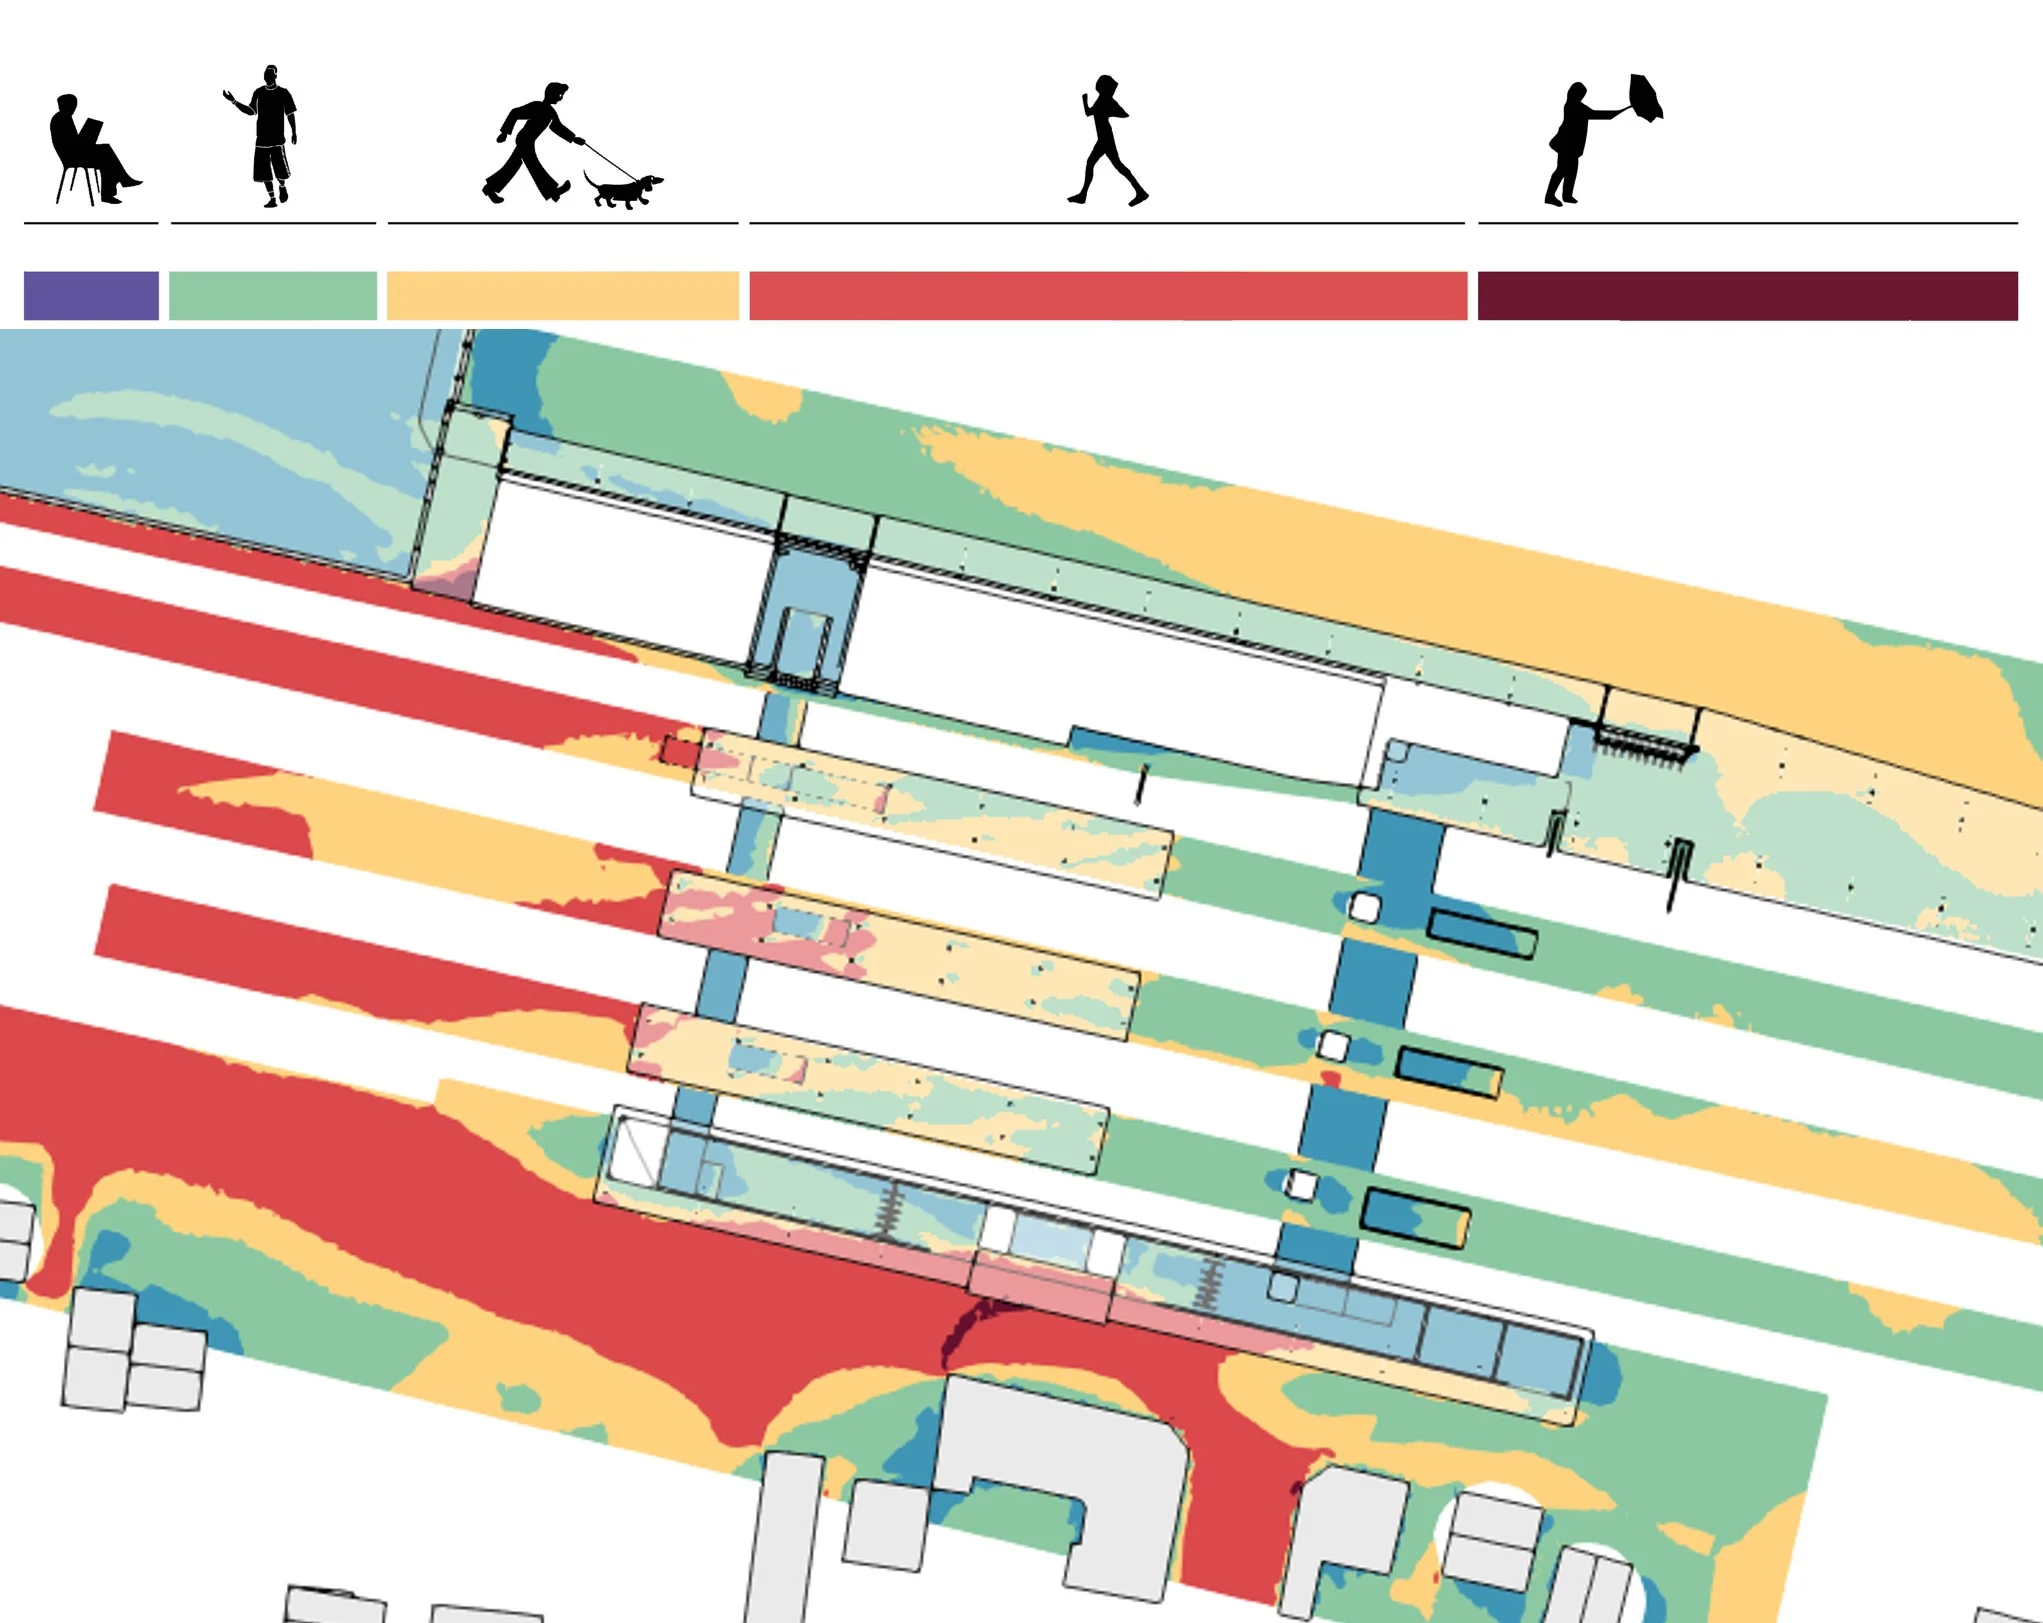
Mapping the wind comfort levels
Contact our experts
alexis.sauvageon@arep.frmateusz.bogdan@arep.fr