☀️ Solar angles
Interactive application to analyze solar trajectories, facade exposure, and the impact of solar shading devices.
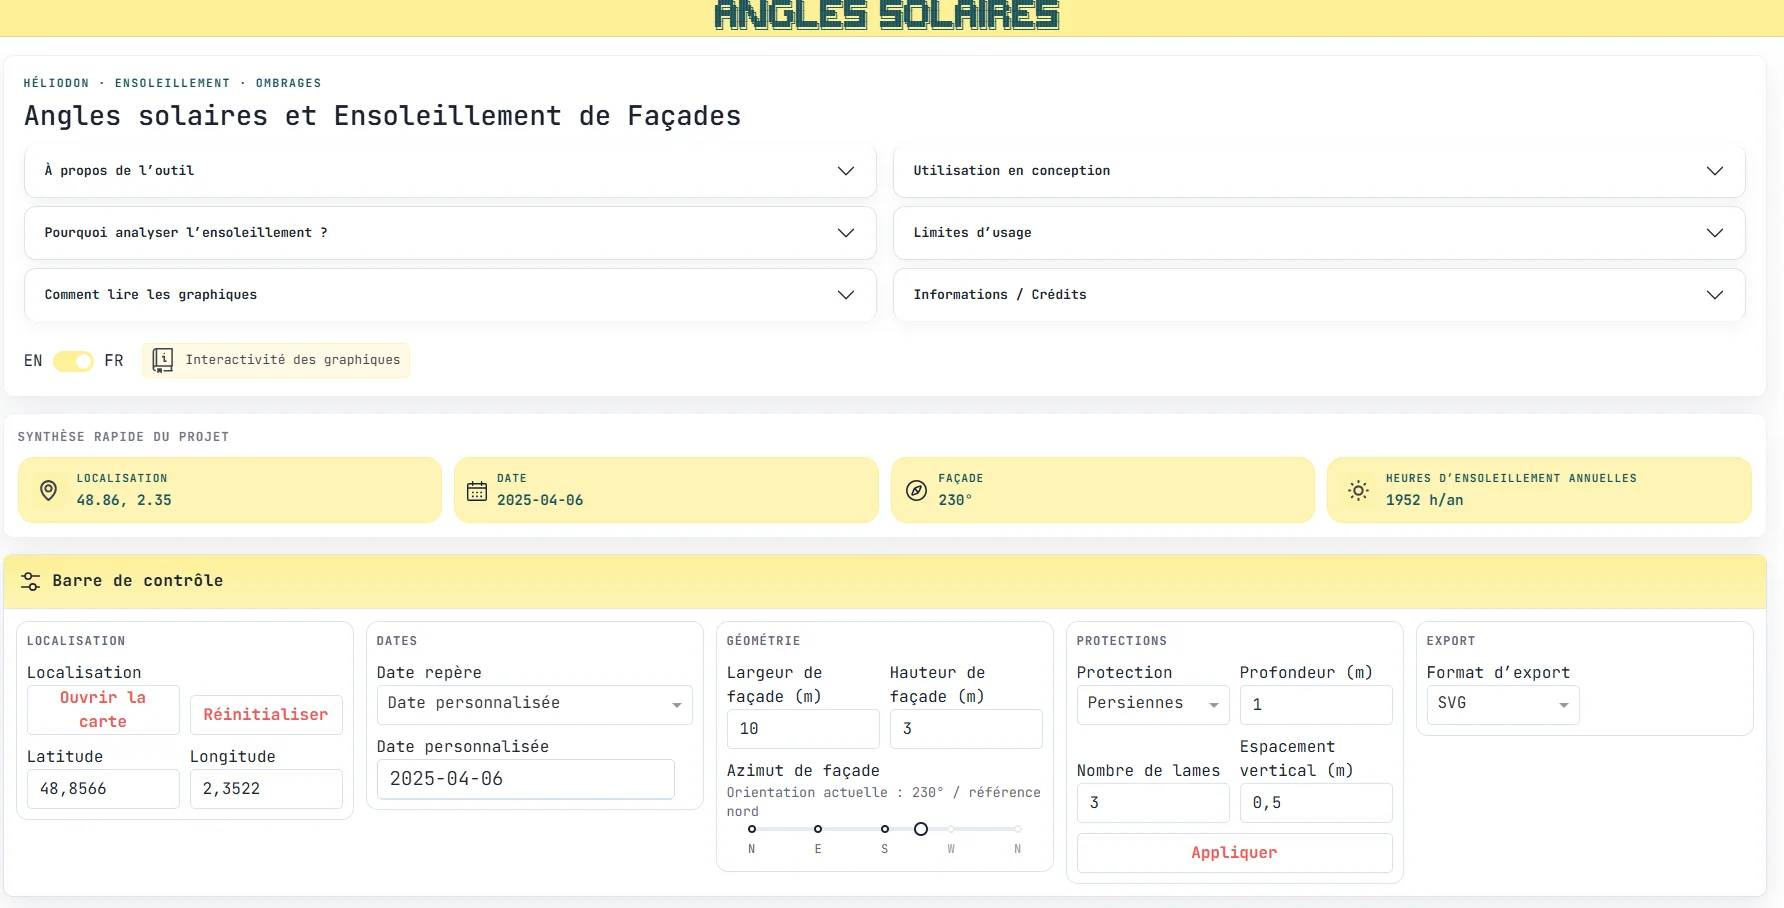
Usage overview
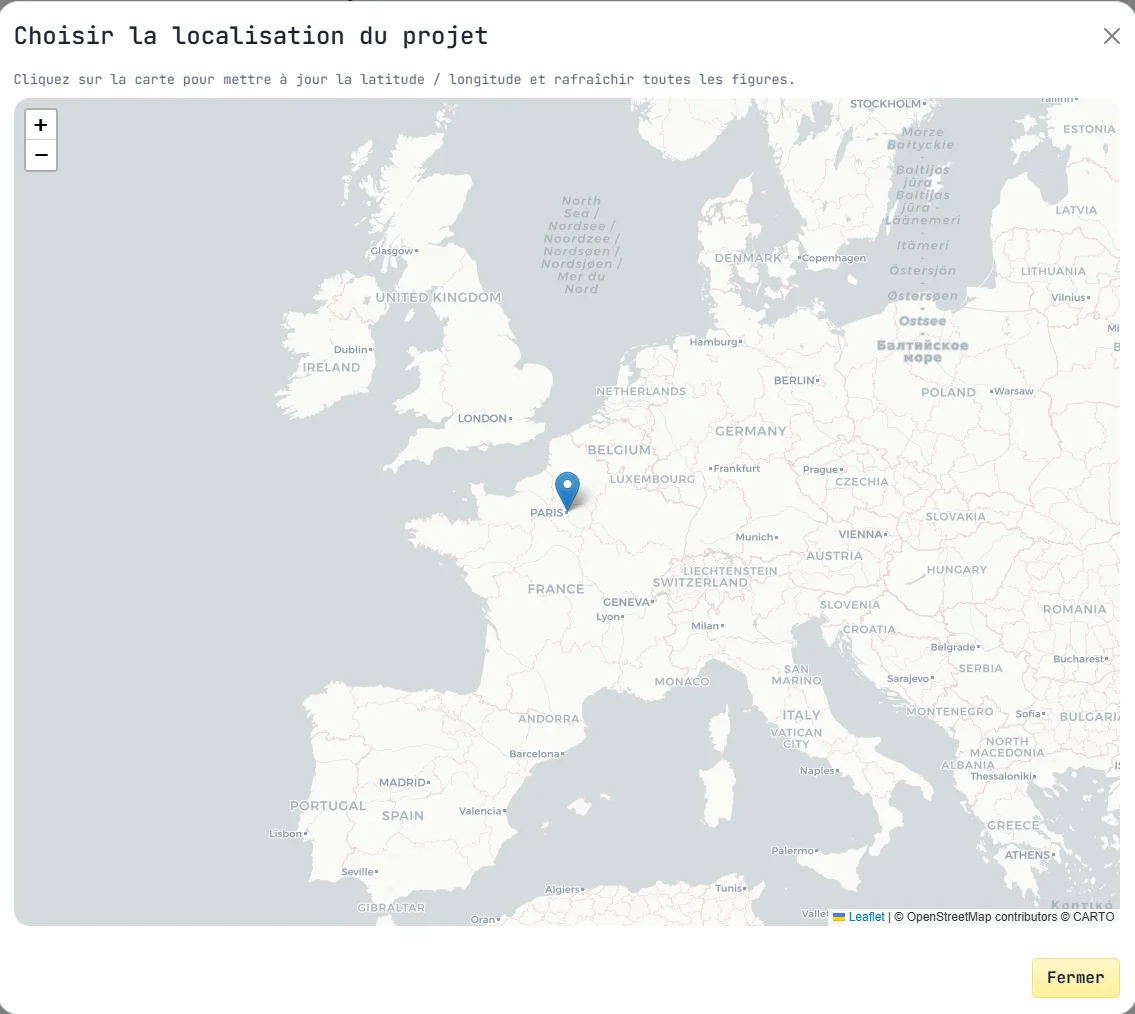
- Select a location,
- Define facade geometry and shading devices,
- Explore the different analysis tabs,
- Optionally load a weather file, or select the closest available dataset
- Export the charts (
pngorsvg).
Why analyze solar exposure?
Solar analysis is a key step in understanding the environmental behavior of a building.
It helps to identify favorable orientations, optimize passive solar gains, properly size shading devices, and anticipate potential discomfort situations such as overheating o glare.
Beyond a static reading, the tool makes it possible to understand the temporal dynamics of the sun and its interaction with the facade.
🏗️ Use in design
Solar exposure analysis directly informs several design decisions, from early concept stages to more advanced phases.
📐 Orientation and envelope
Solar trajectories help evaluate the exposure of different orientations and adjust the uilding envelope composition. This includes the positioning of openings and the balance between opaque and glazed surfaces, depending on project objectives.
🌿 Comfort and usage
Understanding solar exposure over time helps anticipate overheating risks, glare conditions, and the overall quality of daylight throughout the day.
🌍 Environmental strategies
The tool supports the design of passive systems such as overhangs or shading devices, allowing their performance to be assessed depending on geometry and orientation. It also provides a useful basis for comparing different design options.
📊 Available analyses
The application offers several complementary representations, allowing different perspectives to be combined and adapted to project needs.
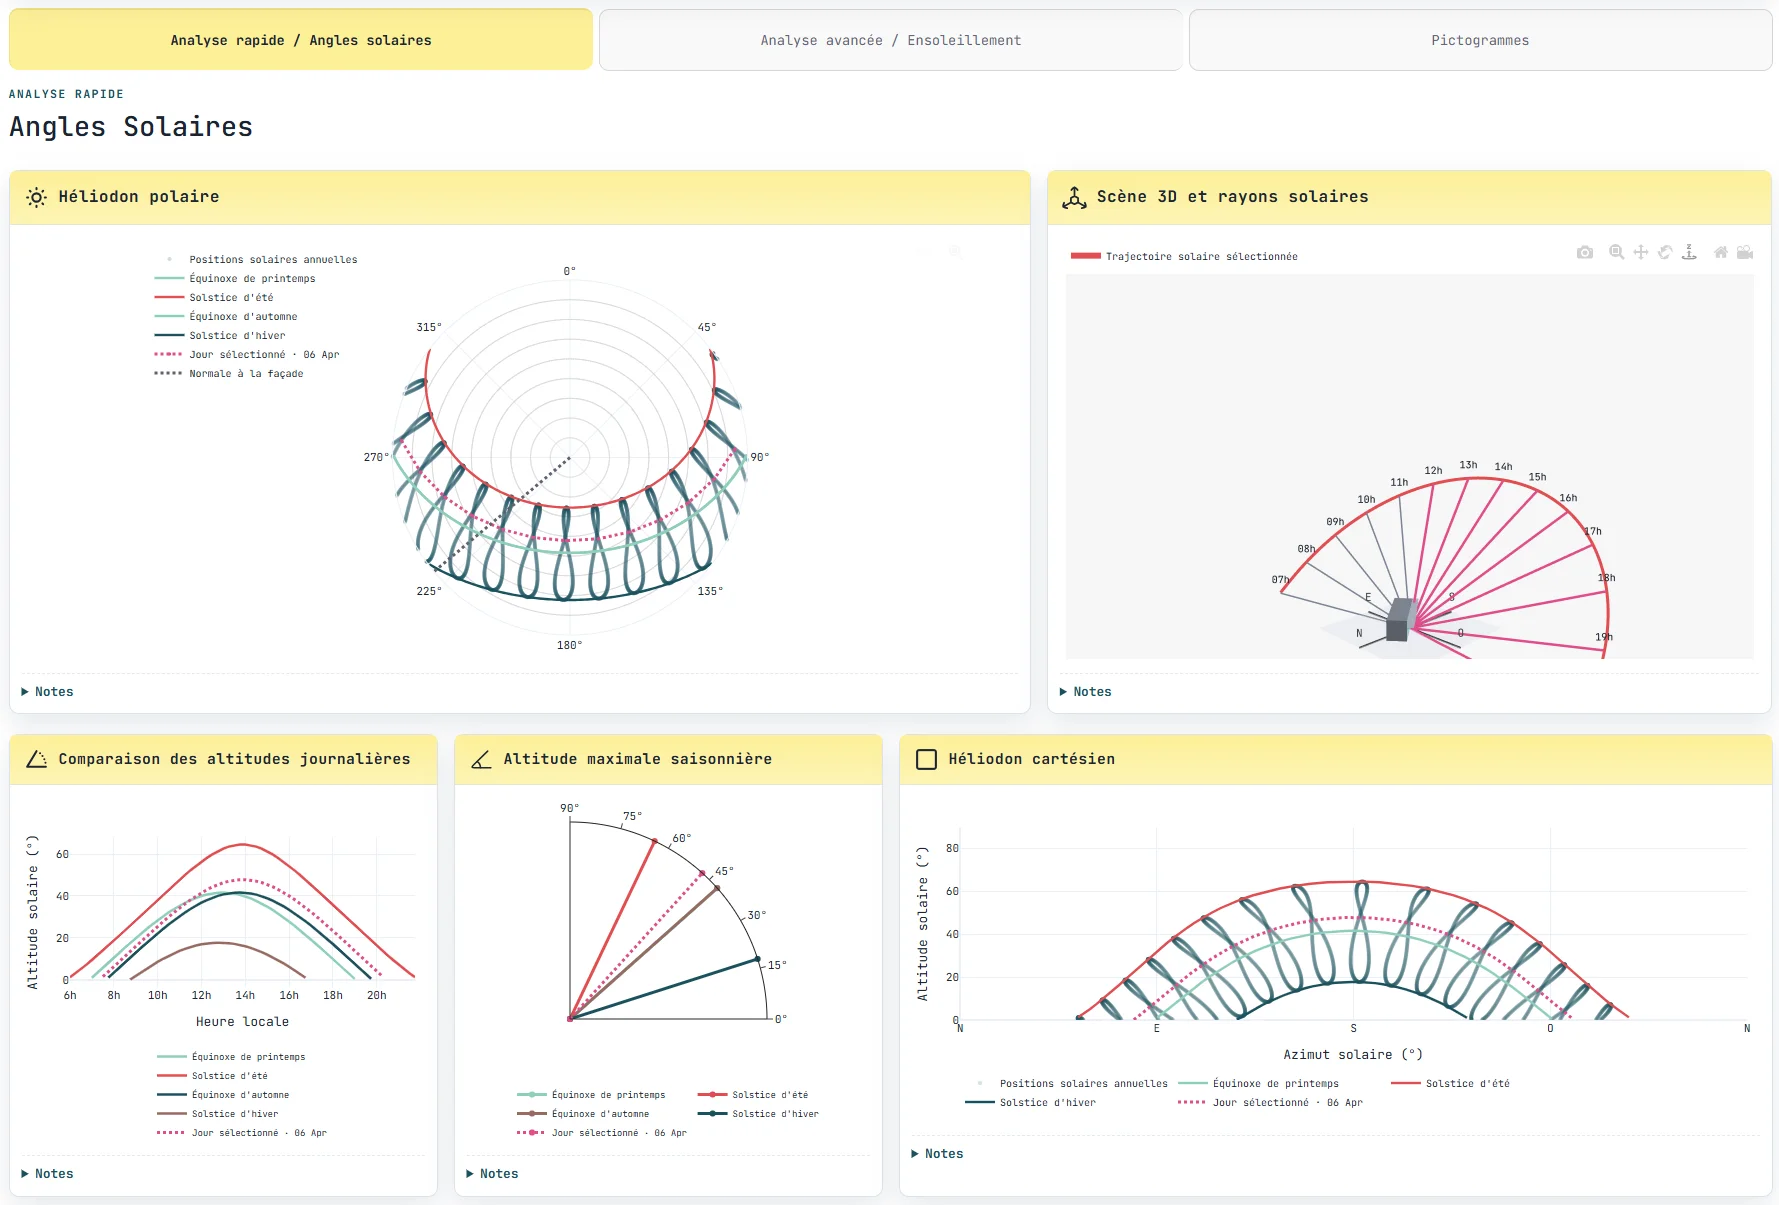
☀️ Heliodon and solar angles
This diagram represents solar paths for key dates (solstices, equinoxes) as well as for a selected day. It provides a direct reading of solar angles and seasonal variations.
Additional charts display maximum solar altitudes and their hourly evolution for selected dates.
🛡️ Types of shading devices
At this stage, the tool includes two types of solar protection systems, covering the most common design cases.
Horizontal overhangs are defined by their depth and provide a simple way to evaluate the effect of facade projections. Louvers (or shading fins) are described through several geometric parameters such as depth, spacing, and number of elements, allowing for a more detailed representation of filtering systems.
These two typologies already cover a wide range of use cases. The tool is intended to evolve, with additional types of shading systems and more complex configurations to be integrated over time.
🧱 3D view
Geometric representation of:
- the facade,
- the shading devices,
- solar rays, whether they reach the facade or not.
This view provides a qualitative understanding of shading phenomena.
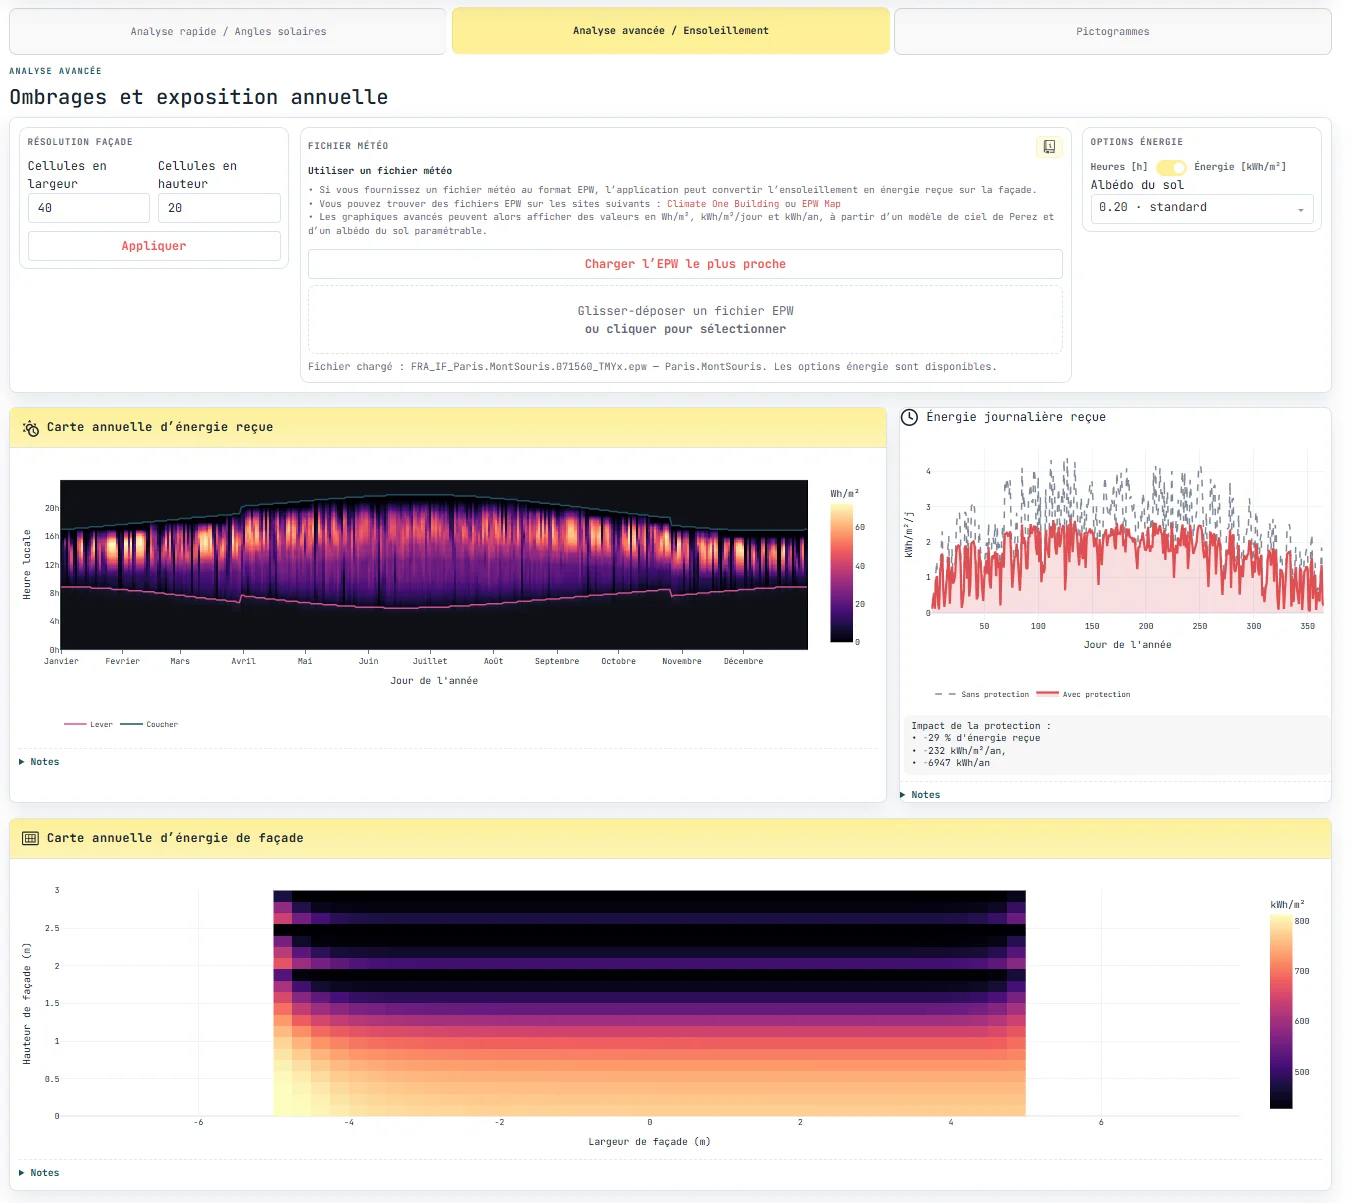
📅 Annual heatmap
The heatmap represents, for each day of the year and each hour of the day, the fraction f the facade receiving direct sunlight.
Light areas correspond to high solar exposure, while darker areas indicate the absence f sunlight, due to orientation or the sun being below the horizon.
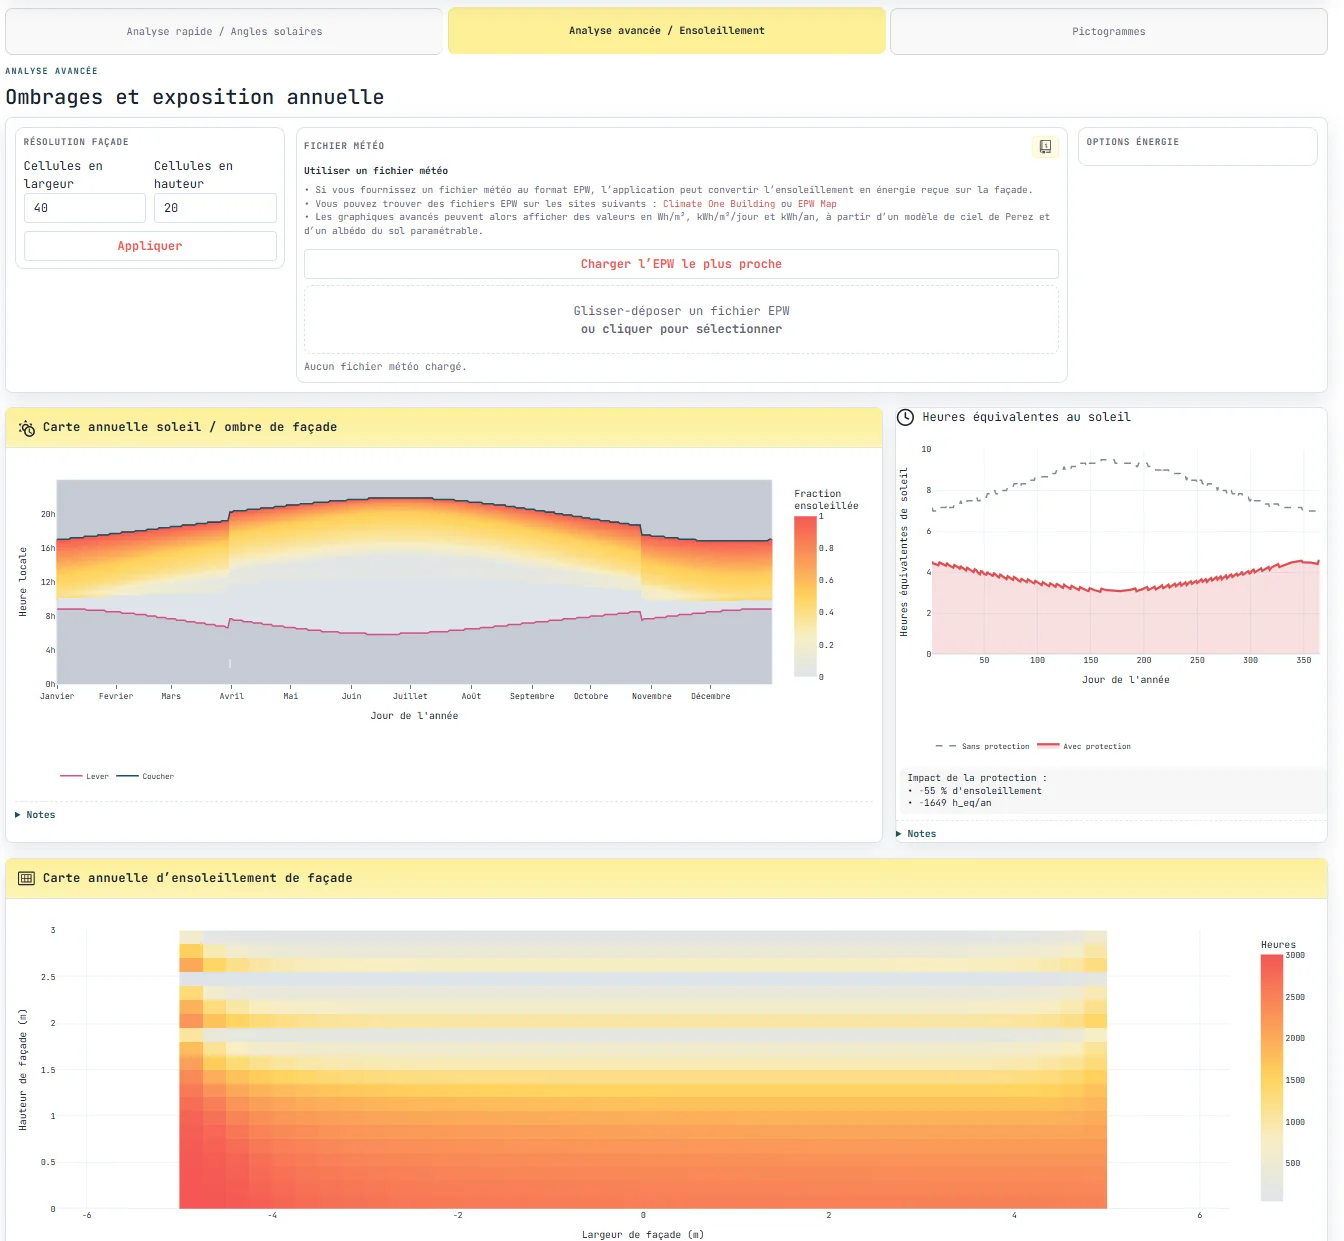
🧭 Facade map
The facade is discretized into a grid (Nx × Ny), allowing spatial representation of
solar exposure. This can be expressed either in equivalent sun hours or, when a weather
ile is used, in received energy.
In this case, results are expressed in kWh/m², enabling a more directly usable nergy-based interpretation.
🧠 Model and approach
Solar geometry
Solar angles are computed using classical astronomical equations:
$$ h = \arcsin(\sin\phi \sin\delta + \cos\phi \cos\delta \cos H) $$where \( \phi \) is the latitude, \( \delta \) the solar declination, and \( H \) the hour angle.
These calculations are handled by the specialized Python library pvlib.
Shading computation
Shading is computed analytically based on facade geometry and shading devices.
The method is inspired by the analytical approach described in:
Shading by Overhang PV Collectors
It enables an exact calculation of shaded areas without relying on computationally expensive ray-tracing techniques.
Energy model
When an EPW weather file is provided, solar exposure can be converted into incident
energy on the facade. The model decomposes radiation into direct, diffuse, and
eflected components:
The sunlit fraction of the facade weights the direct component, while sky diffuse and ground-reflected radiation are added globally. The model relies on the Perez sky model with a configurable ground albedo.
🌦️ Weather data
The application can operate in two modes:
- purely geometric (no weather file),
- energy-based using an
epwfile.
Users can either provide a standard EPW file or select the closest available dataset from Climate One Building.
Possible sources (non-exhaustive):
Automatically loaded datasets correspond to typical meteorological years (TMYx), based on long-term averages (~30 years).
⚙️ Methodology
Calculations rely on hourly data and a vectorized approach, allowing efficient processing of large time series. The facade is discretized into a configurable grid, on which the sunlit fraction is evaluated.
This fraction is used to weight indicators. For example, one hour with 50% of the acade sunlit corresponds to 0.5 equivalent sun hours.
⚠️ Limitations
The tool does not account for distant urban obstructions, vegetation, or building thermal interactions.
The energy model relies on simplified assumptions, particularly regarding diffuse radiation and ground reflection, which are considered homogeneous.
🛠️ Implementation
Application developed in Python using Dash-Plotly
.
Main libraries:
pvlibfor solar and irradiance calculationsPandasandNumPyfor data processingDash Leafletfor the map,Dash Bootstrap Componentsfor the interface