🚂 SNCF-Transilien stations and line usage
In order to easily visualise the global attendance at SNCF-Transilien stations and lines, we’ve created this dynamic map to showcase the data available on SNCF open-data. To achieve this, we are using two datasets:
- annual station frequentation, from 2015 to 2021 ( link ),
- A geocoding table for the “UIC codes” (unique station identifiers, defined by the International Union of Railways.) to obtain the location of stations ( link ).
- And to make it nice, the actual colrs for each lines, taken from here
Options
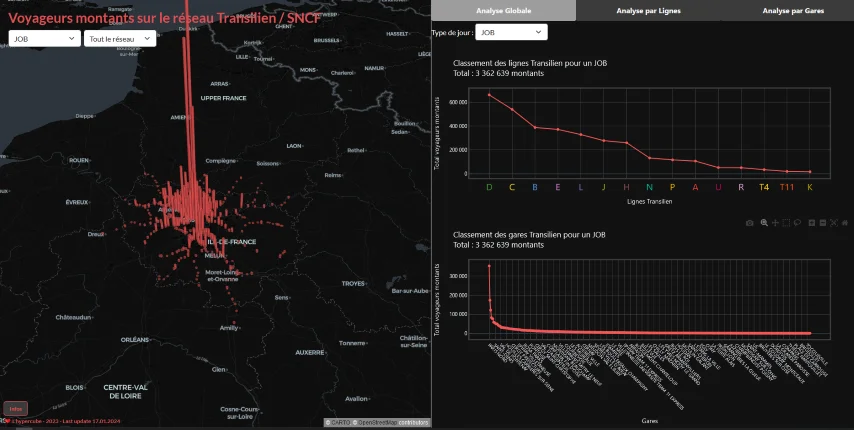
The application is divided into two parts that interact responsively with each other (when possible):
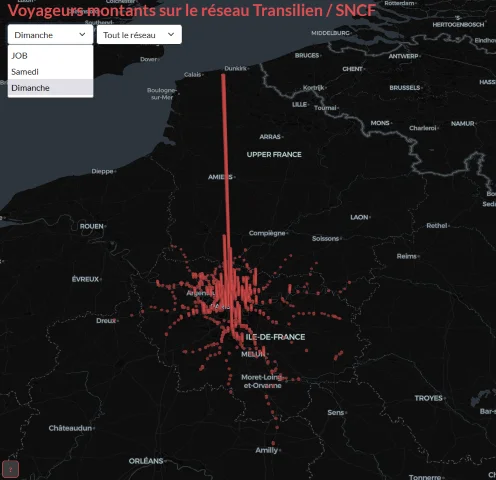
- On the left side, the overall visualization, with two dropdown menus allwoing:
- The selection of types of days (weekdays, saturdays, sundays),
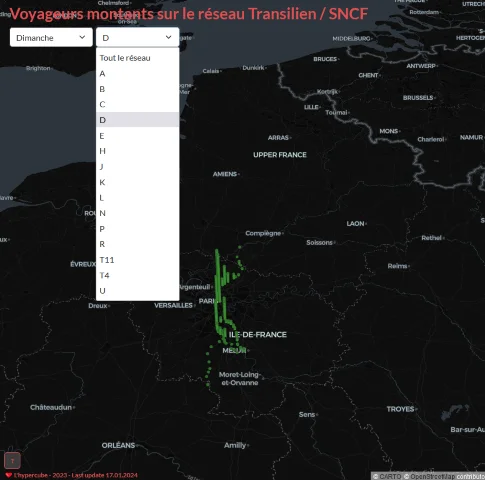
- The choice of lines
- On the right side, the analyses, with three tabs:
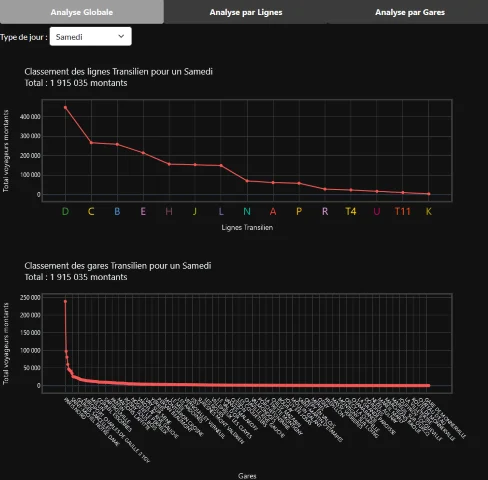
- A global analysis of network usage, including:
- Ranking of lines,
- Ranking of network stations.
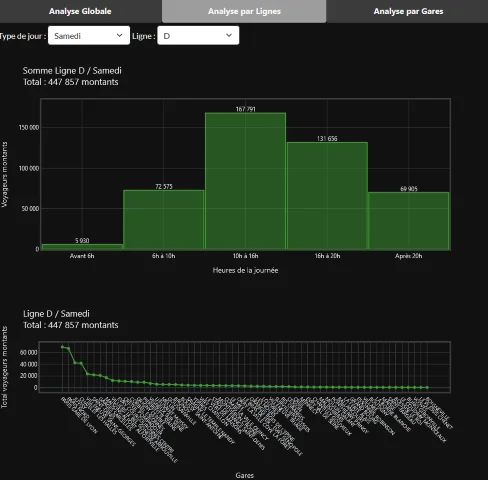
- An analysis of usage per line:
- Evolution of usage throughout the day,
- Ranking of stations on the line.
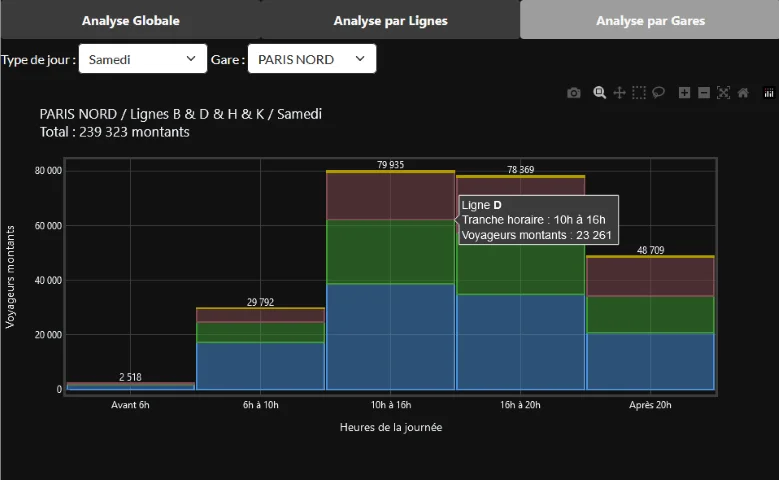
- Finally, an analysis of usage per station:
- With the evolution of usage throughout the day,
- With the share of each line passing through the station."
- A global analysis of network usage, including:
The code
The code is available on Gitlab :
Following our fisrt web app, we kept testing the pydeck
,
a library that acts as a binder between Deck.gl
- a javascript library
based on the WebGL framework for visualising large amounts of data - and Python, and
Dash Deck
, which provides a link with Dash
!