Comfort STD
Interactive application for visually exploring thermal comfort from dynamic building energy simulation (BES) results or measurements.
How to use
The tool allows you to load data from simulations or measurements, then explore them through various comfort indicators.
Data can be imported:
- by drag-and-drop of
csvfiles, - by direct copy-paste (from
Excelfor example), with column mapping.
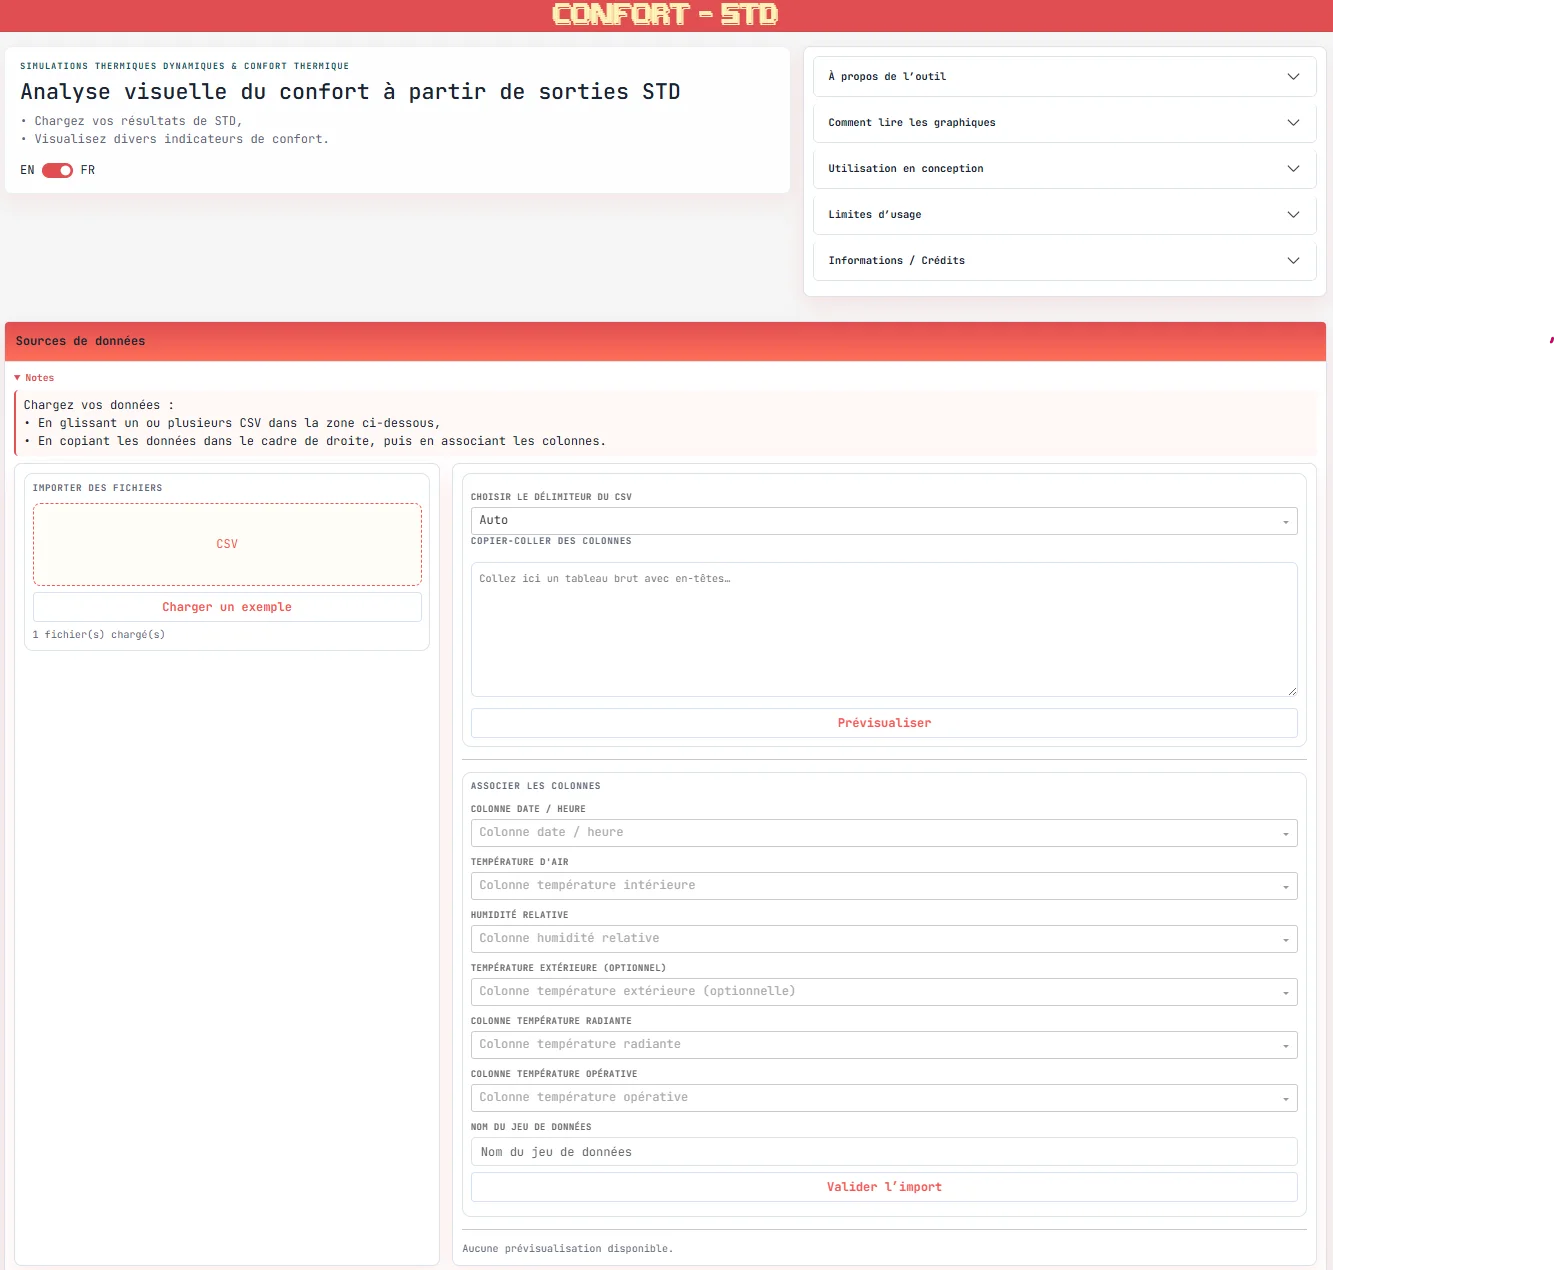
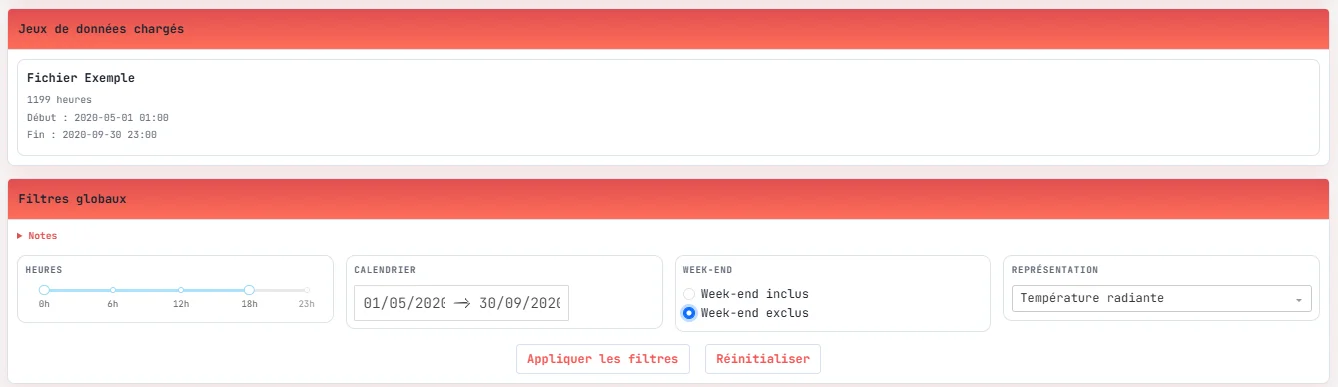
Once the data is loaded, global filters allow you to narrow the analysis (time ranges, periods, weekdays), before exploring the charts and exporting results.
🎯 Objective
The tool aims to provide a clear and visual read of thermal comfort, making it easier to interpret BES outputs that are often large and difficult to analyse.
It enables you to:
- compare different simulation variants,
- identify critical periods,
- quantify time spent in comfortable or uncomfortable conditions,
- support design trade-off decisions.
📊 Available analyses
▶️ More information on comfort indicators 🔗
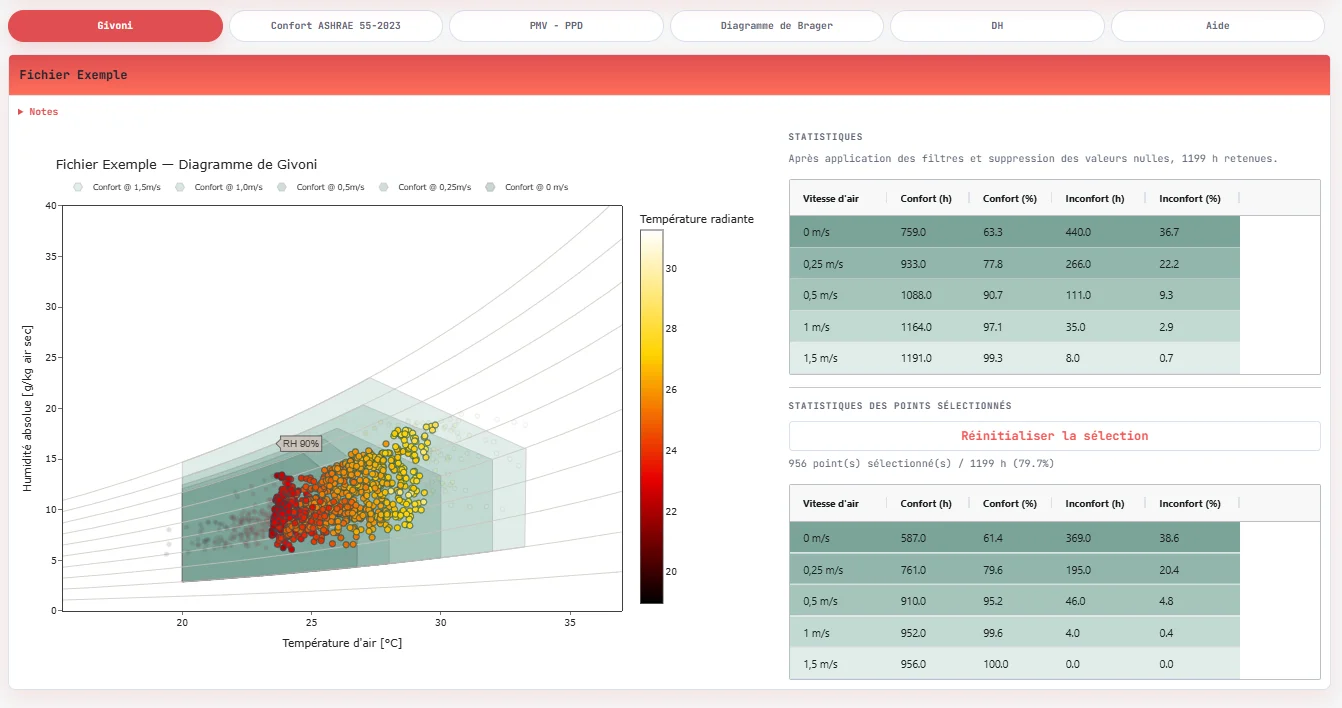
Givoni bioclimatic chart
The Givoni chart plots indoor conditions (temperature, humidity) against comfort zones, factoring in air speed.
These zones are defined for sedentary activity and summer clothing
(clo ≈ 0.5), and can be adjusted based on air speed. A frequency representation (heatmap) also visualises the most occupied zones.
The chart is based on a hygrothermal representation in a (temperature – absolute humidity) plane. Comfort zones are derived from bioclimatic references and depend notably on air speed, with interpolation between different ventilation regimes.
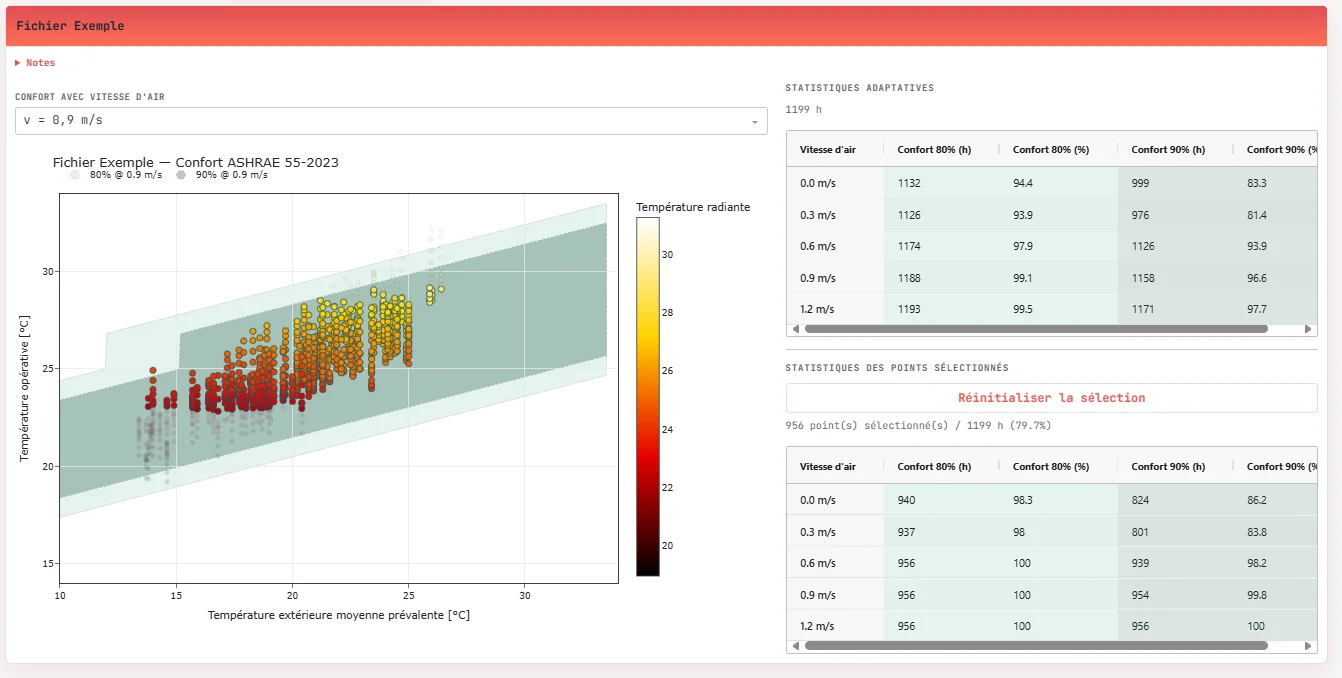
Adaptive comfort (ASHRAE 55 – 2023)
The adaptive model is based on the running mean outdoor temperature and applies to naturally ventilated buildings.
It defines dynamic comfort zones (80% and 90% acceptability) that evolve with outdoor conditions and air speed.
The adaptive model relies on a running mean outdoor temperature:
$$ T_{rm} = (1-\alpha)(T_{ext,j-1} + \alpha T_{ext,j-2} + \dots) $$The comfort temperature is then defined by:
$$ T_{comfort} = 0.31 \cdot T_{rm} + 17.8 $$Acceptability bands (80% / 90%) qualify the conditions.
In the tool, these calculations are performed using the adaptive_ashrae function
from the pythermalcomfort library, explicitly integrating multiple air speeds
(0 to 1.2 m/s) to analyse the effect of ventilation on comfort.
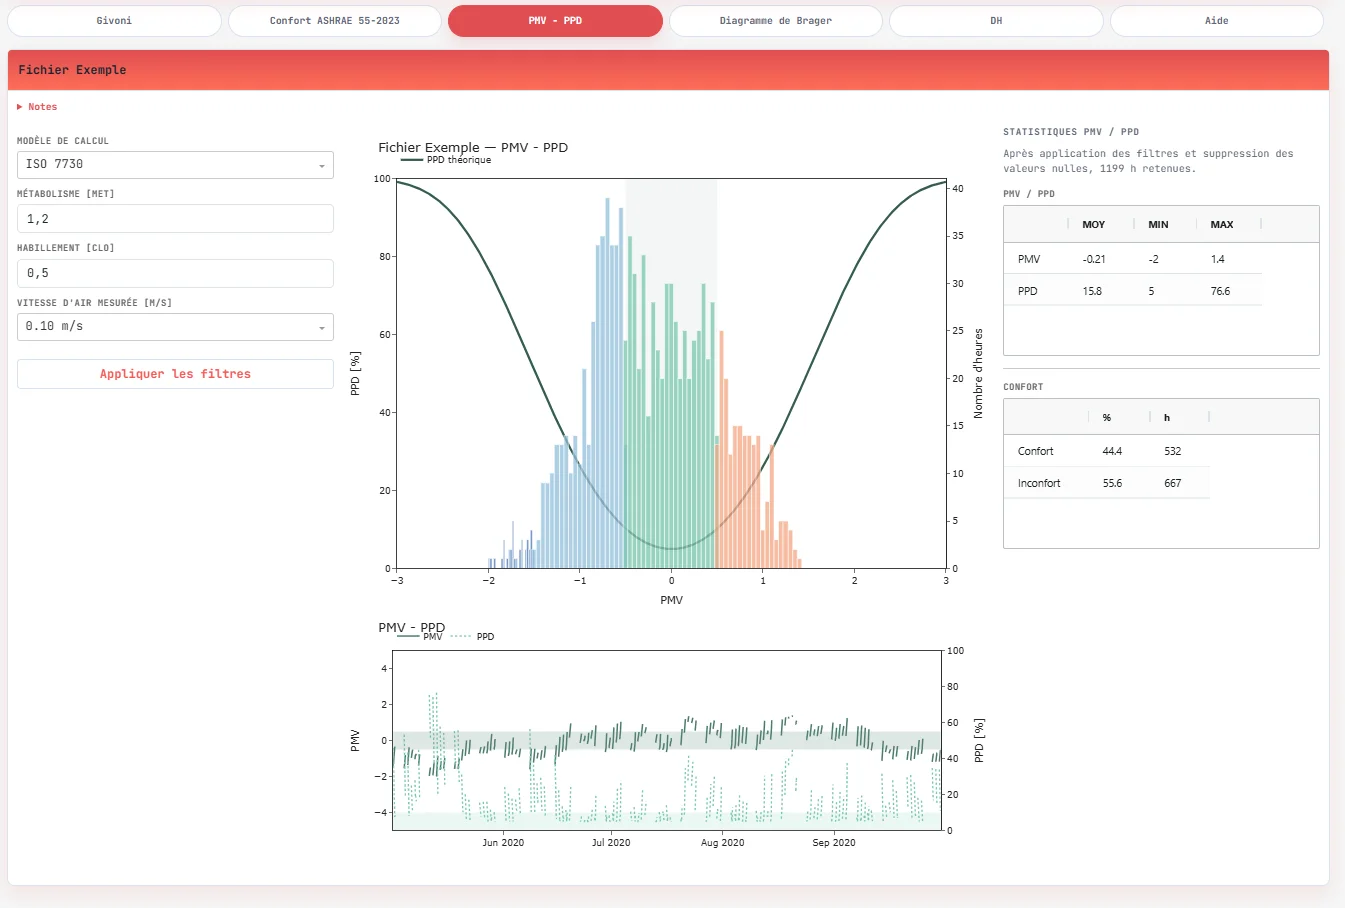
PMV – PPD
In addition to the bioclimatic and adaptive approaches, the tool evaluates thermal
comfort using the PMV (Predicted Mean Vote) and PPD (Predicted Percentage of Dissatisfied) indices, following either ISO 7730 or ASHRAE 55.
These indicators are based on the human body’s thermal balance and take into account:
- air temperature,
- radiant temperature,
- humidity,
- air speed,
- as well as user assumptions (metabolism, clothing).
In the application, calculations are performed using the pmv_ppd_iso or
pmv_ppd_ashrae functions from pythermalcomfort, accounting for:
- relative air speed (
v_relative), - dynamic clothing insulation (
clo_dynamic_isoorclo_dynamic_ashrae).
These indicators provide a more normative comfort assessment, complementing adaptive approaches, and help analyse the proportion of time spent in comfort (typically defined as -0.5 < PMV < 0.5).
Interactive analysis
All charts are interconnected. Points can be selected directly in the diagrams (lasso, click), dynamically filtering the data and recalculating the associated indicators.
This interaction facilitates the exploration of specific situations (hot periods, night-time, etc.) and fine-grained analysis of data subsets.
Complementary indicators
Beyond the graphical representations, the tool provides a set of summary indicators to quantify results:
- global statistics (number of hours, percentage of time in comfort),
- summaries per imported file or selected period.
These indicators are recalculated dynamically based on filters and selections, providing quantitative output directly usable in the design phase.
Planned improvements include:
- the Brager chart,
- degree-hours (DH) according to RE2020.
Input data
The expected data include at minimum:
- a date / time,
- an air temperature,
- a relative humidity.
Additional variables can be used:
- outdoor temperature,
- radiant temperature,
- operative temperature.
⚠️ Usage limits
Results are highly dependent on:
- the quality of the input data,
- simulation assumptions,
- the calculation rules applied.
The tool does not account for:
- actual occupant behaviour,
- dynamic building effects (thermal mass, regulation),
- fine-grained interactions with the environment.
🛠️ Implementation
Application developed in Python with Dash
, enabling
interactive data exploration.
Main libraries used:
pythermalcomfortfor thermal comfort calculationsPandasandNumPyfor data processingDash Bootstrap Componentsfor the interfaceDash AG Gridfor table display