🚂 Yearly passengers in SNCF train stations
In order to easily visualise the annual number of passengers at SNCF stations, we’ve created this dynamic map to showcase the data available on SNCF open-data. To achieve this, we are using two datasets:
- annual station frequentation, from 2015 to 2021 ( link ),
- A geocoding table for the “UIC codes” (unique station identifiers, defined by the International Union of Railways.) to obtain the location of stations ( link ).
Options
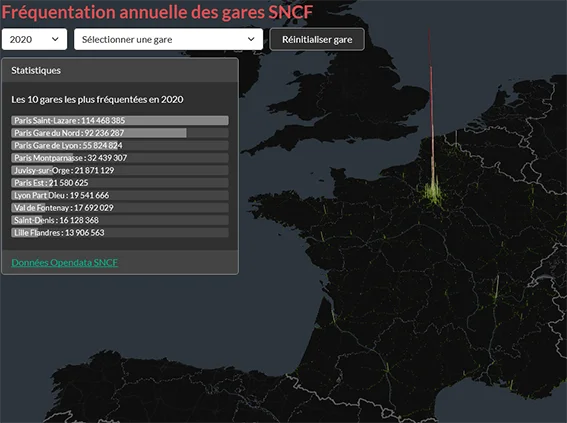
- Choose a year:
- Visualise visitor numbers in the form of a spatial histogram,
- See the top 10 busiest stations.
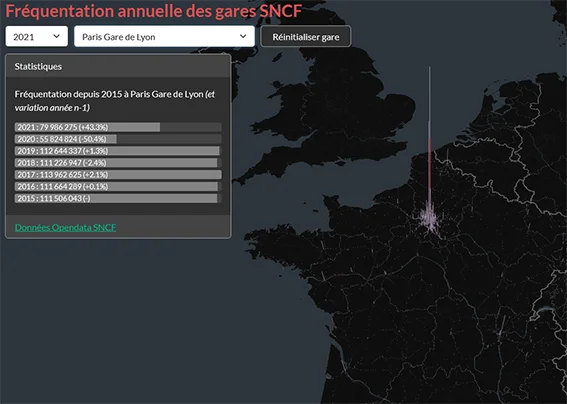
- Choose a train station and a year:
- View the station’s frequentation in a national context,
- See the trend in passenger numbers at this station between 2015 and 2021.
The code
The code is available on Gitlab :
The idea was born out of the discovery of pydeck
,
a library that acts as a binder between Deck.gl
- a javascript library
based on the WebGL framework for visualising large amounts of data - and Python, and
Dash Deck
, which provides a link with Dash
!