Comfort BES
Interactive application for visually exploring thermal comfort based on results from Building Energy Simulations (BES) or measured data.
Usage overview
The tool allows users to load data from simulations or measurements and explore it through various comfort indicators.
Data can be imported:
- by drag-and-dropping
csvfiles, - or by direct copy-paste (e.g. from
Excel), with column mapping.
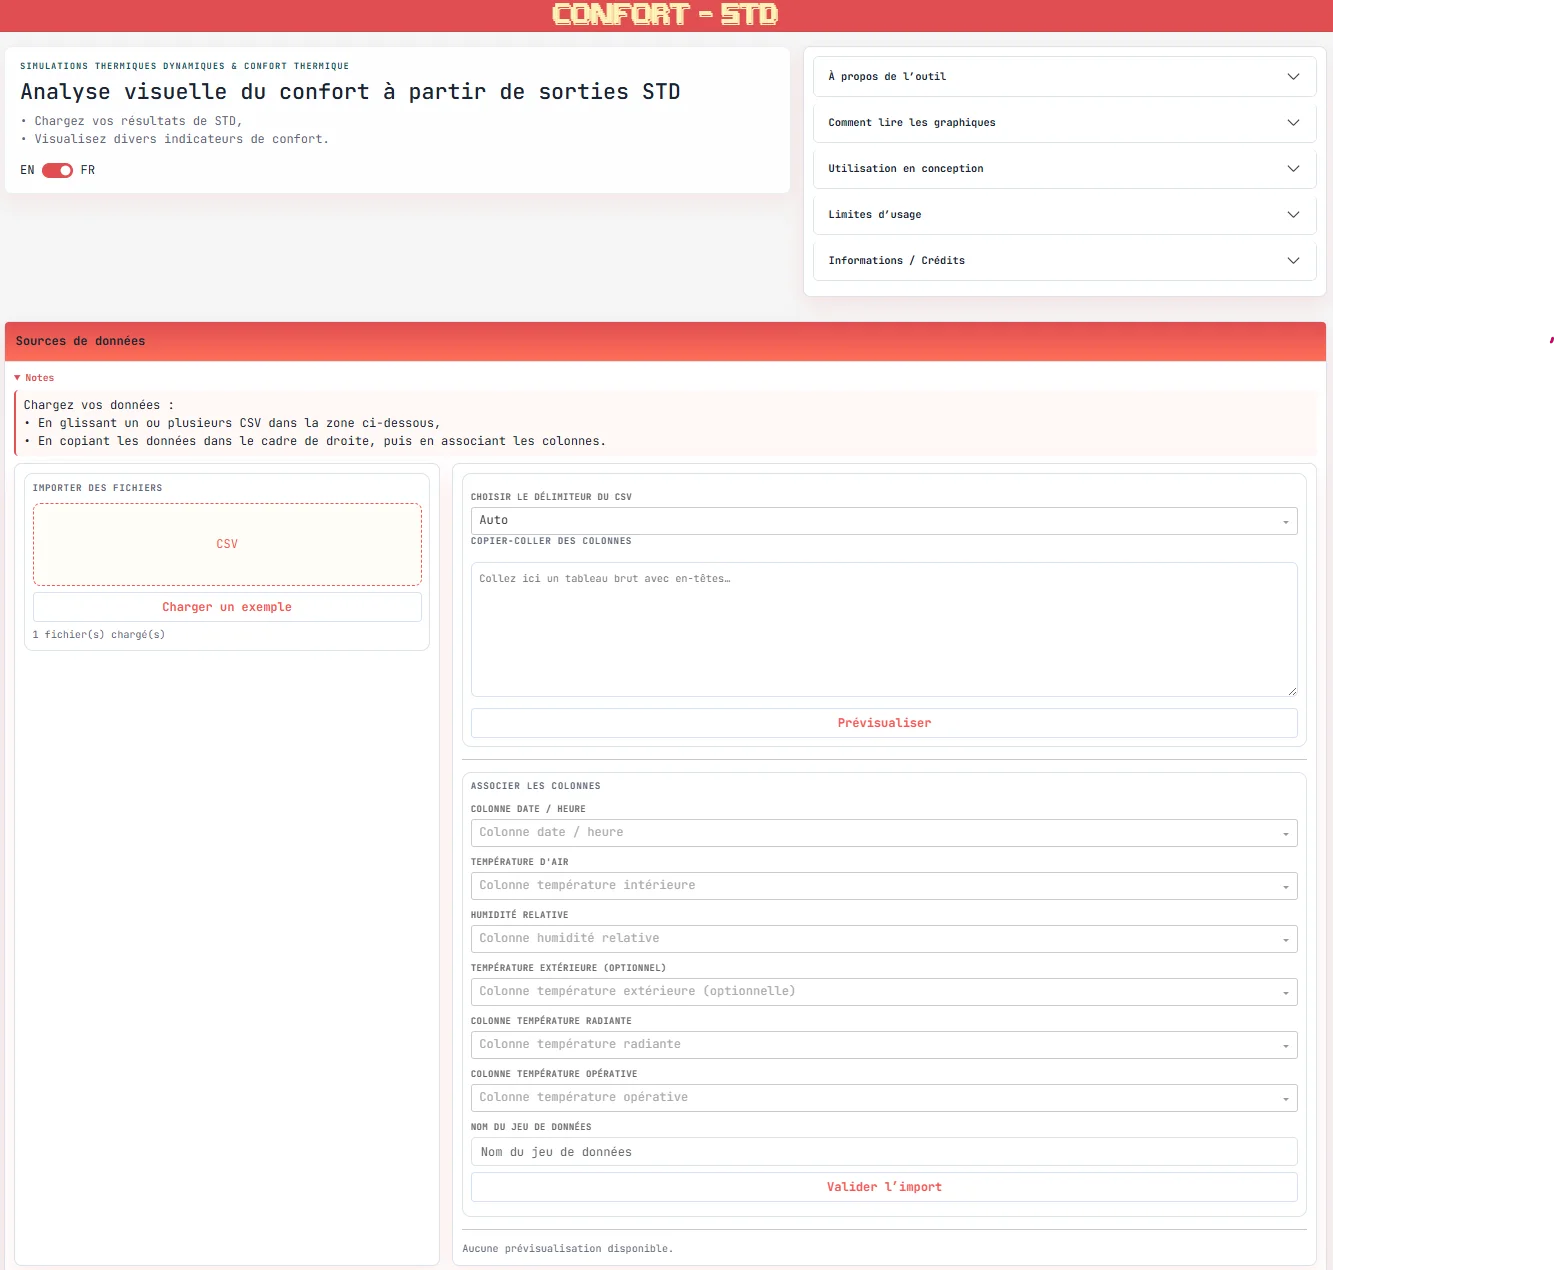
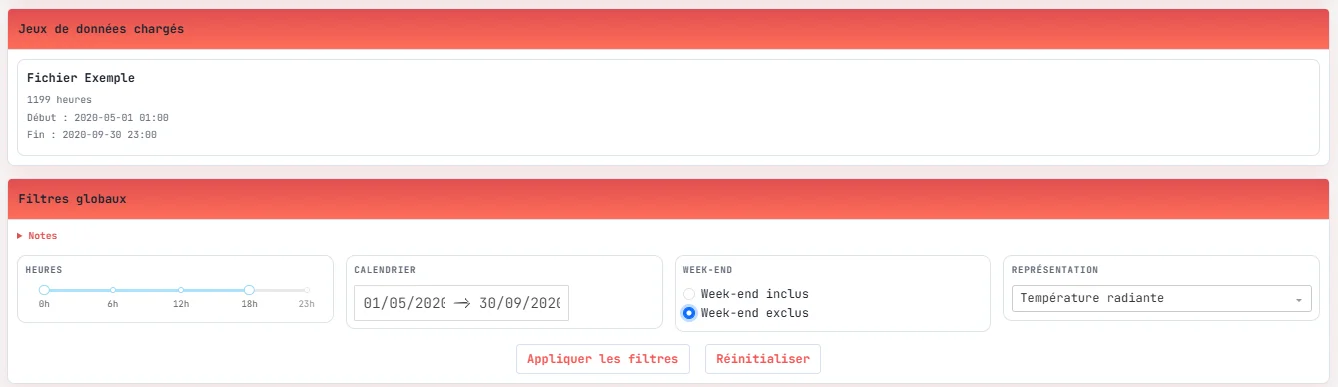
Once the data is loaded, global filters can be applied (time ranges, periods, weekdays), before exploring the charts and exporting results.
🎯 Objective
The tool aims to provide a clear and visual interpretation of thermal comfort, making large STD outputs easier to analyze and understand.
It allows users to:
- compare different simulation variants,
- identify critical periods,
- quantify the time spent in comfort or discomfort,
- support design decision-making with objective indicators.
📊 Available analyses
▶️ More information on comfort indicators 🔗
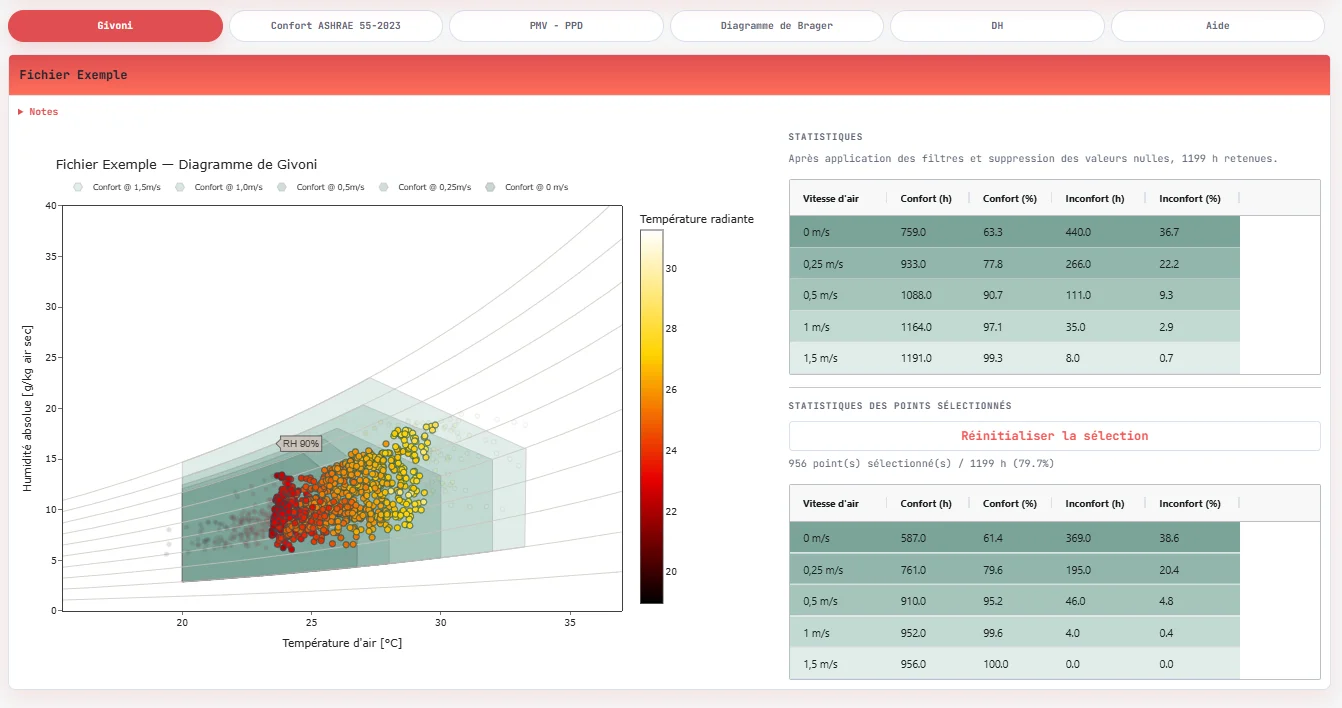
Givoni bioclimatic chart
The Givoni chart represents indoor conditions (temperature and humidity) and positions them relative to comfort zones, depending on air velocity.
These zones are defined for sedentary activity and summer clothing conditions
(clo ≈ 0.5), and can be adjusted according to air speed. A frequency-based
representation (heatmap) allows visualization of the most frequently occurring conditions.
The diagram is based on a hygrothermal representation in a temperature–absolute humidity space. Comfort zones originate from bioclimatic references and vary with air speed, with interpolation between different ventilation regimes.
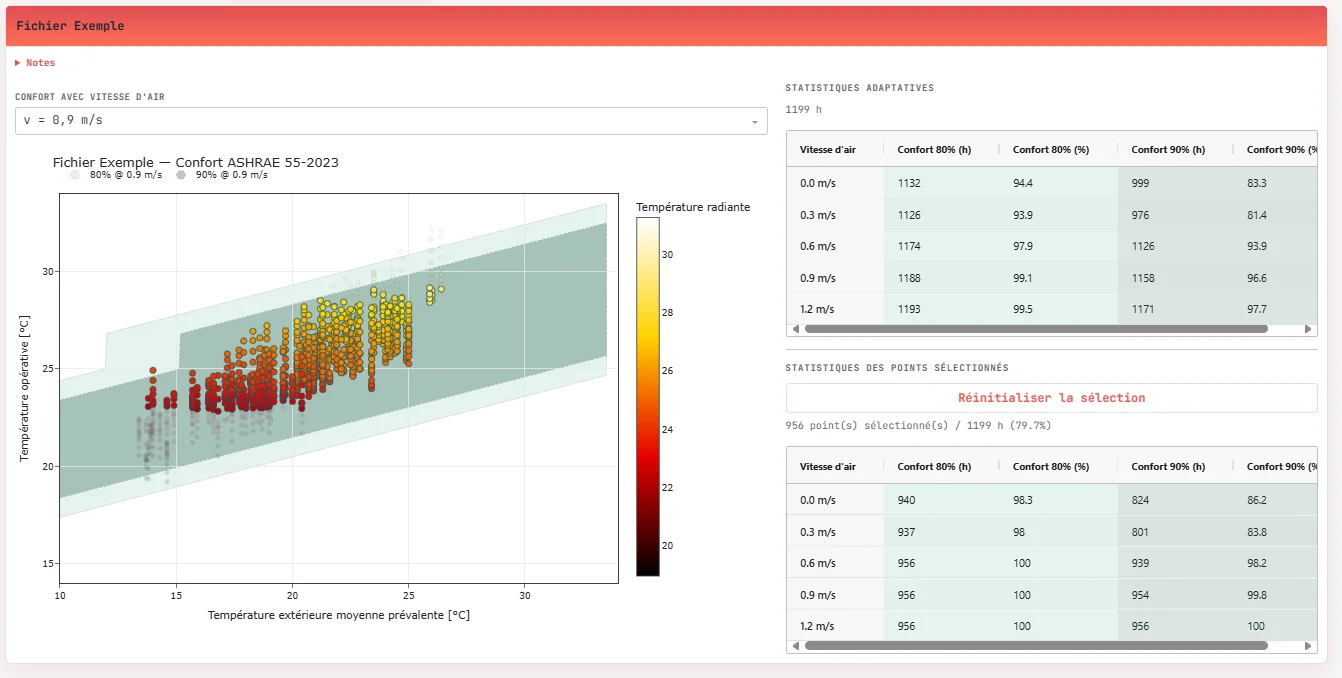
Adaptive comfort (ASHRAE 55 – 2023)
The adaptive model is based on a running mean outdoor temperature and applies to naturally ventilated buildings.
It defines dynamic comfort zones (80% and 90% acceptability), which evolve depending on outdoor conditions and air speed.
The model relies on a running mean outdoor temperature:
$$ T_{rm} = (1-\alpha)(T_{ext,j-1} + \alpha T_{ext,j-2} + \dots) $$
The comfort temperature is then defined as:
$$ T_{comfort} = 0.31 \cdot T_{rm} + 17.8 $$
Acceptability bands (80% / 90%) are used to assess comfort conditions.
In the tool, these calculations are performed using the adaptive_ashrae function
from the pythermalcomfort library, explicitly accounting for multiple air speeds
(0 to 1.2 m/s) to evaluate the impact of ventilation.
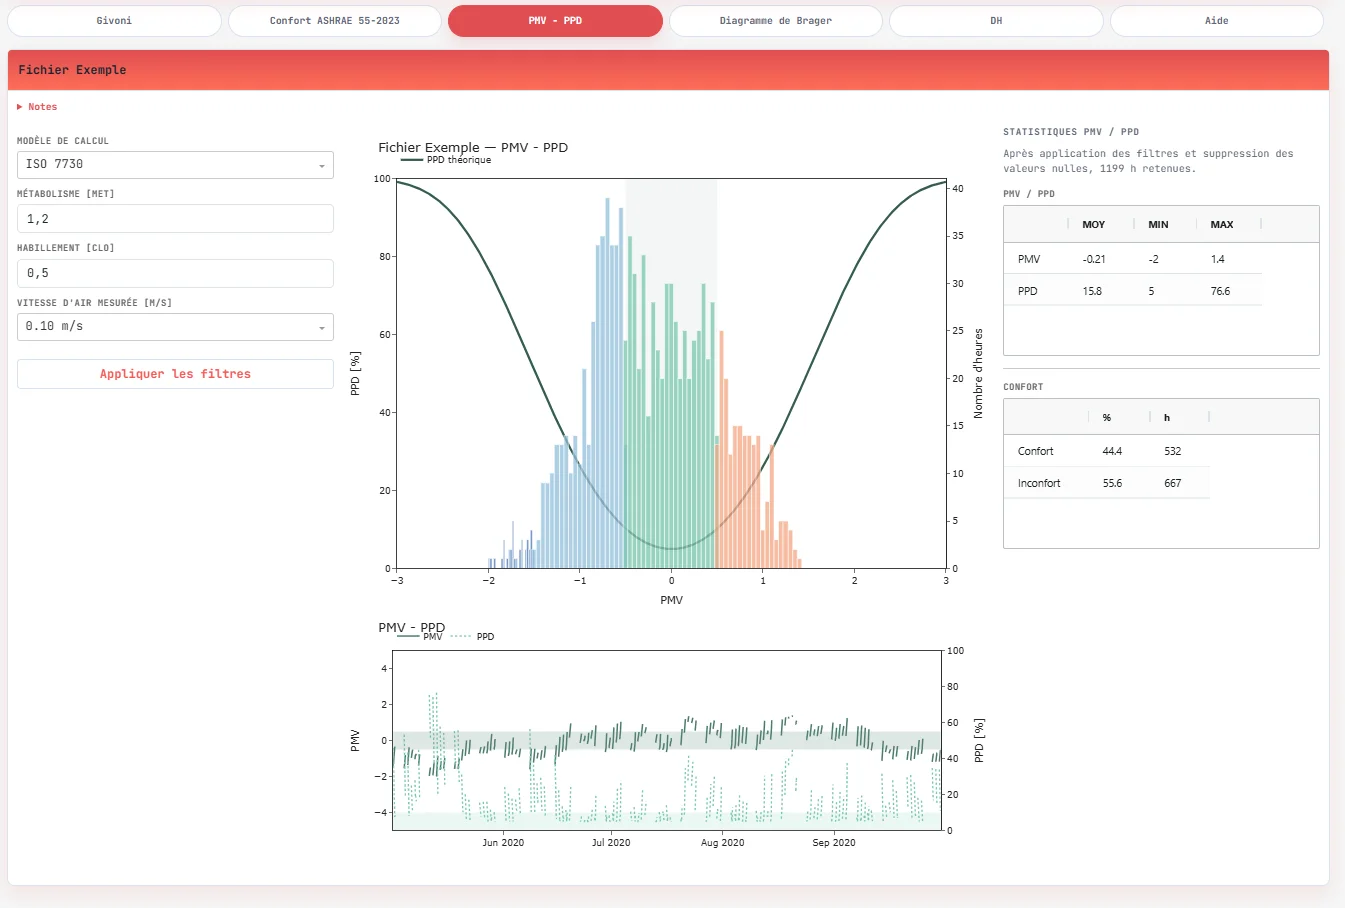
PMV – PPD
In addition to bioclimatic and adaptive approaches, the tool allows thermal comfort
assessment using PMV (Predicted Mean Vote) and PPD (Predicted Percentage of Dissatisfied)
indices, based on either ISO 7730 or ASHRAE 55.
These indices rely on a heat balance model of the human body and take into account:
- air temperature,
- mean radiant temperature,
- humidity,
- air speed,
- as well as user-defined assumptions (metabolic rate, clothing).
In the application, calculations are performed using pmv_ppd_iso or
pmv_ppd_ashrae from pythermalcomfort, including:
- relative air speed (
v_relative), - dynamic clothing insulation (
clo_dynamic_isoorclo_dynamic_ashrae).
These indicators provide a more normative evaluation of comfort, complementing adaptive approaches, and allow quantification of the time spent in comfort conditions (typically defined as -0.5 < PMV < 0.5).
Interactive analysis
All charts are interconnected. It is possible to select data points directly within the graphs (lasso, click), enabling dynamic filtering and recalculation of indicators.
This interaction makes it easier to explore specific situations (hot periods, nighttime, etc.) and perform detailed analysis on subsets of data.
Additional indicators
Beyond graphical representations, the tool provides a set of synthetic indicators to quantify results:
- global statistics (number of hours, percentage of time in comfort),
- summaries per imported dataset or selected period.
These indicators are dynamically updated based on filters and selections, allowing for a quantitative interpretation directly usable during design phases.
Future developments include:
- Brager adaptive chart,
- degree-hours (DH) calculations according to RE2020 (French standard).
Input data
The minimum required data includes:
- date / time,
- air temperature,
- relative humidity.
Additional variables can be used:
- outdoor temperature,
- mean radiant temperature,
- operative temperature.
⚠️ Limitations
Results strongly depend on:
- input data quality,
- simulation assumptions,
- applied calculation methods.
The tool does not account for:
- actual occupant behavior,
- building dynamic effects (thermal inertia, control systems),
- detailed environmental interactions.
🛠️ Implementation
Application developed in Python using Dash
, enabling
interactive data exploration.
Main libraries used:
pythermalcomfortfor thermal comfort calculationsPandasandNumPyfor data processingDash Bootstrap Componentsfor the interfaceDash AG Gridfor table visualization