🌬️ Wind rose
Application for visualizing wind occurrences by direction and speed, based on historical meteorological data.
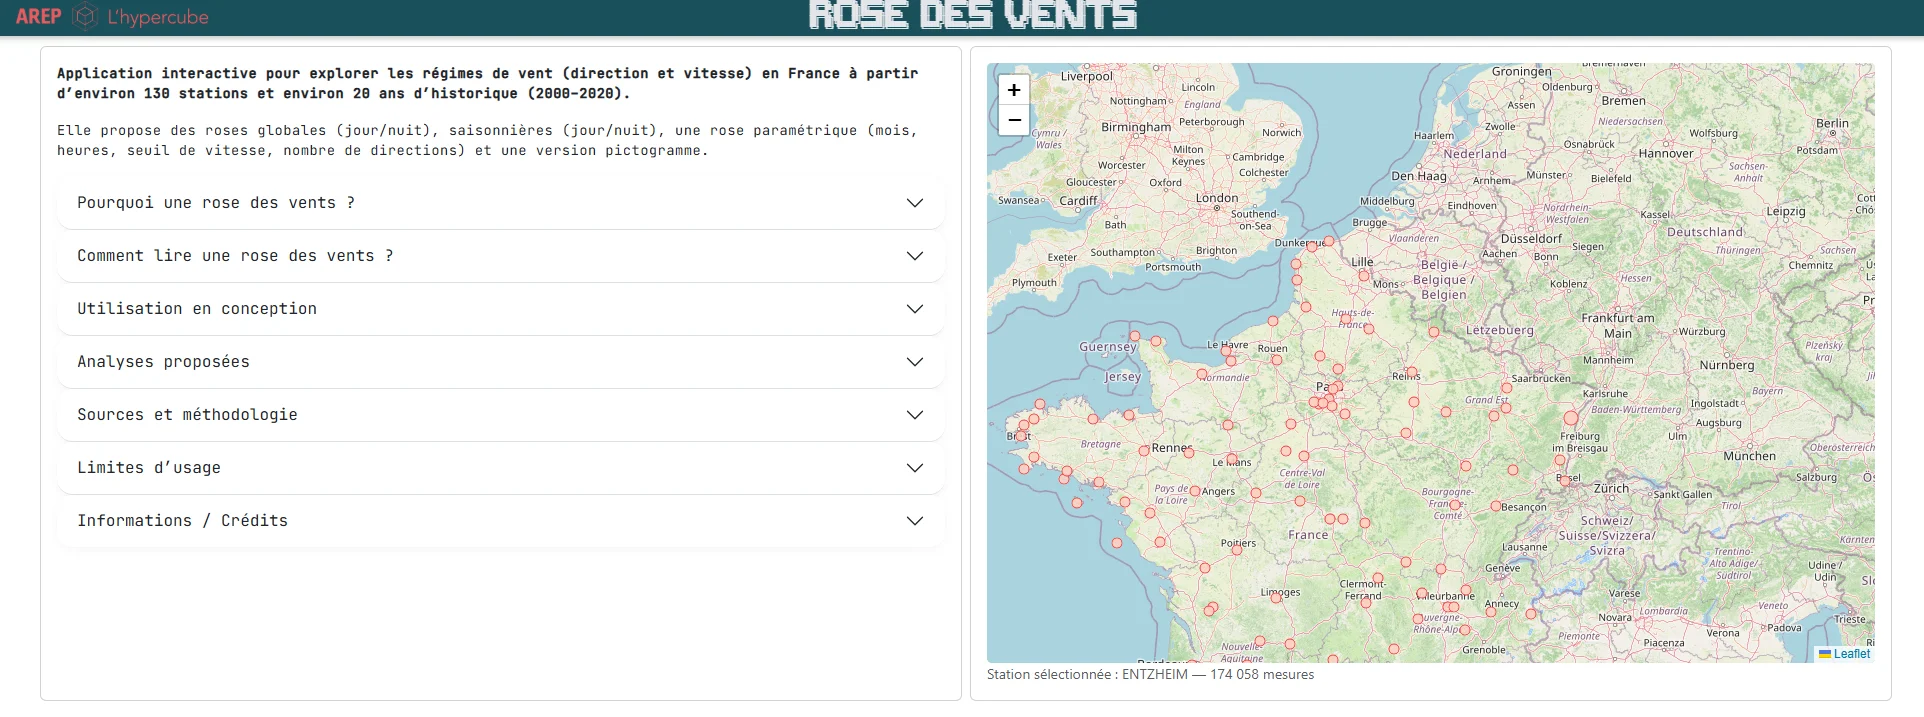
Usage overview:
- Select a meteorological station.Coverage includes metropolitan France and overseas territories (543 stations).
- Load the data,
- Explore the different tabs,
- Export the charts.
Why use a wind rose?
The wind rose is a classical tool for climate analysis, providing a synthetic representation of wind direction and speed distributions over a given period.
Where simple averages tend to obscure underlying dynamics, this representation highlights the structure of the wind regime: dominant directions, seasonal variations, day/night differences, and the relative frequency of low and high wind speeds.
It therefore provides a first-level understanding of the local wind climate, directly usable both in early design phases and in more detailed studies.
🏗️ Use in design
Understanding wind patterns informs many design decisions, across different scales.
📐 Layout and orientation
Analyzing dominant wind directions helps to:
- orient main façades,
- position accesses and circulation paths,
- organize outdoor spaces according to exposed or sheltered areas.
🌿 Comfort and usage
Wind data also makes it possible to anticipate:
- acceleration and turbulence phenomena, particularly in urban environments,
- the design of protection strategies (screens, vegetation, built volumes),
- summer comfort through natural ventilation.
🌍 Environmental strategies
At a broader scale, the wind rose contributes to environmental design strategies by supporting:
- optimization of natural ventilation systems,
- consideration of contextual effects (masking, Venturi effects, urban roughness).
It therefore provides a basis for upstream analysis before more advanced studies such as CFD modeling or microclimate simulations.
📊 Available analyses
The application offers several levels of analysis, allowing adaptation to project context and objectives.
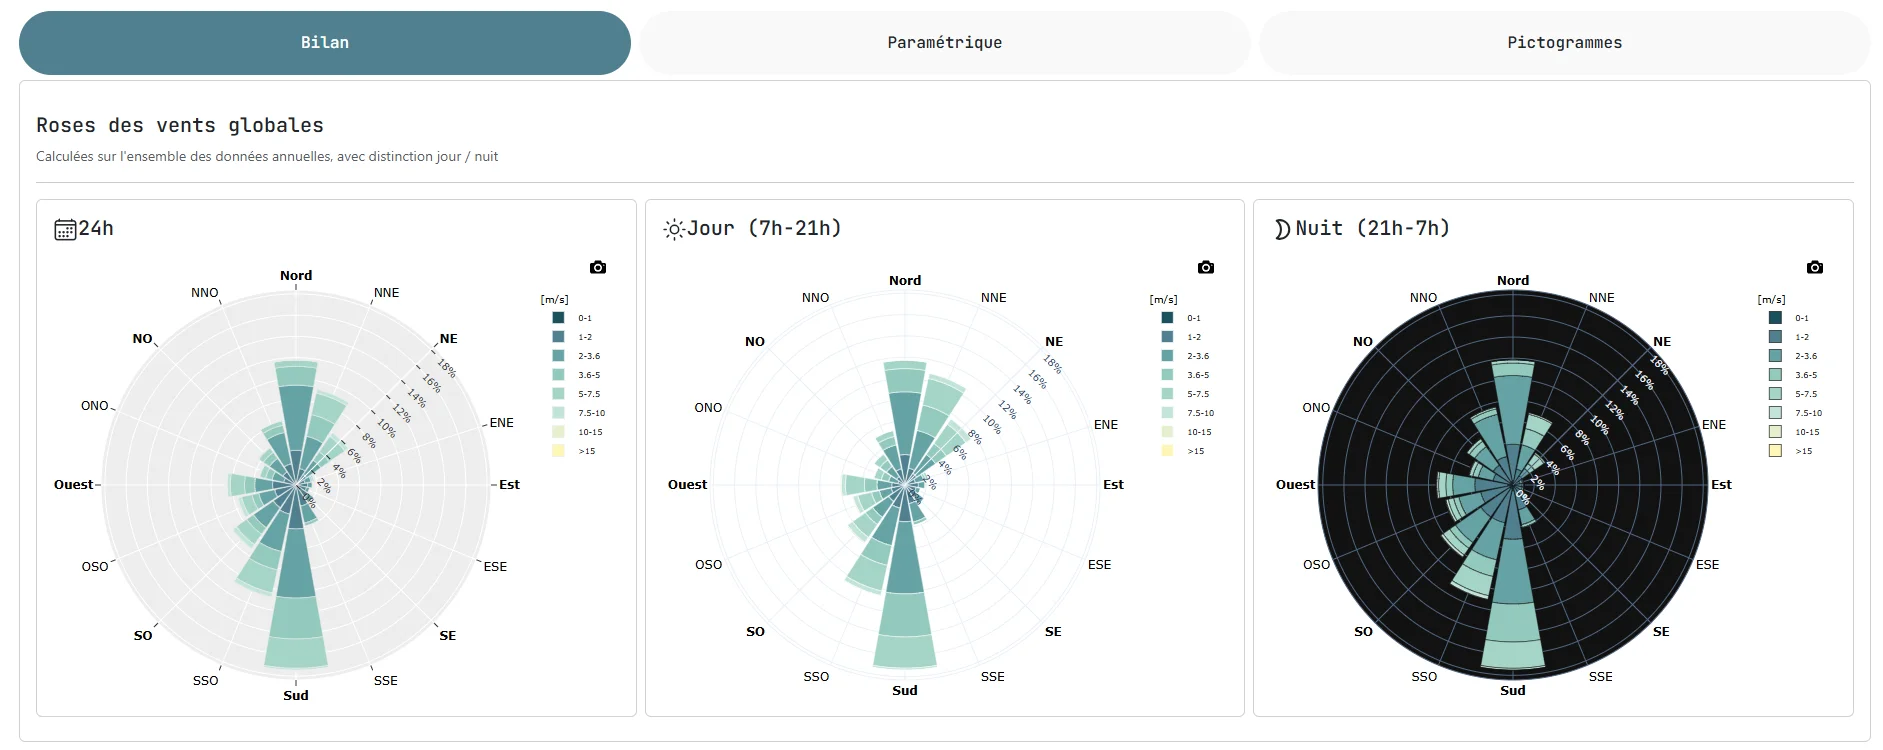
- A first approach consists of a global wind rose, providing an overall view of the full dataset. This can be refined through a day / night distinction, highlighting thermal effects or local breeze phenomena.
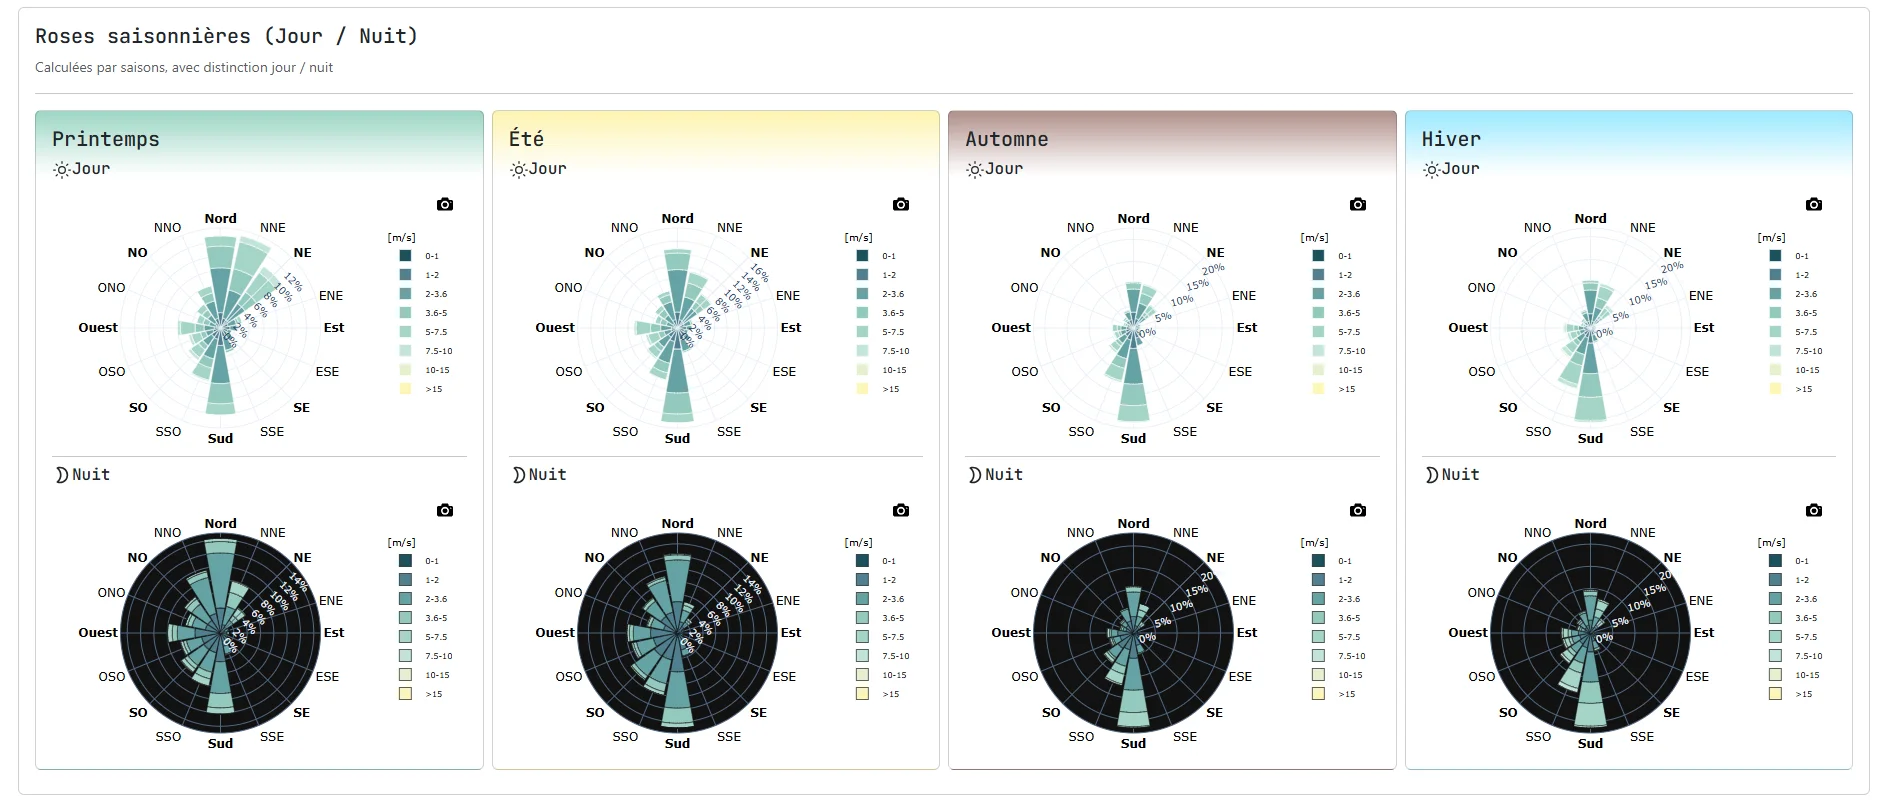
- Seasonal wind roses then allow identification of contrasts between winter and ummer periods, often critical in design decisions.
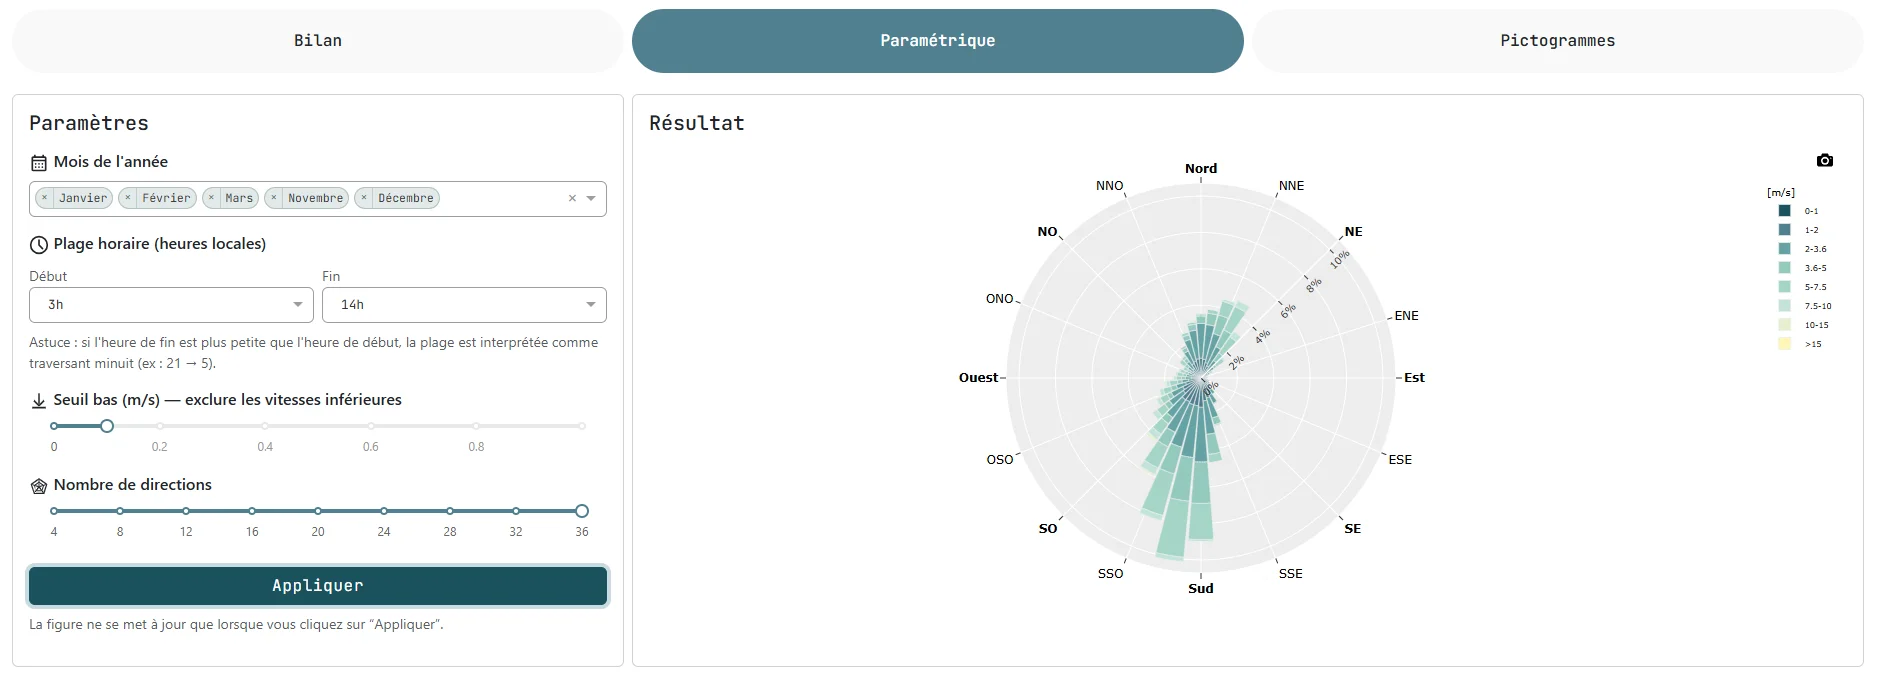
- For more targeted analyses, a parametric version allows filtering by time range, season, or wind speed thresholds.
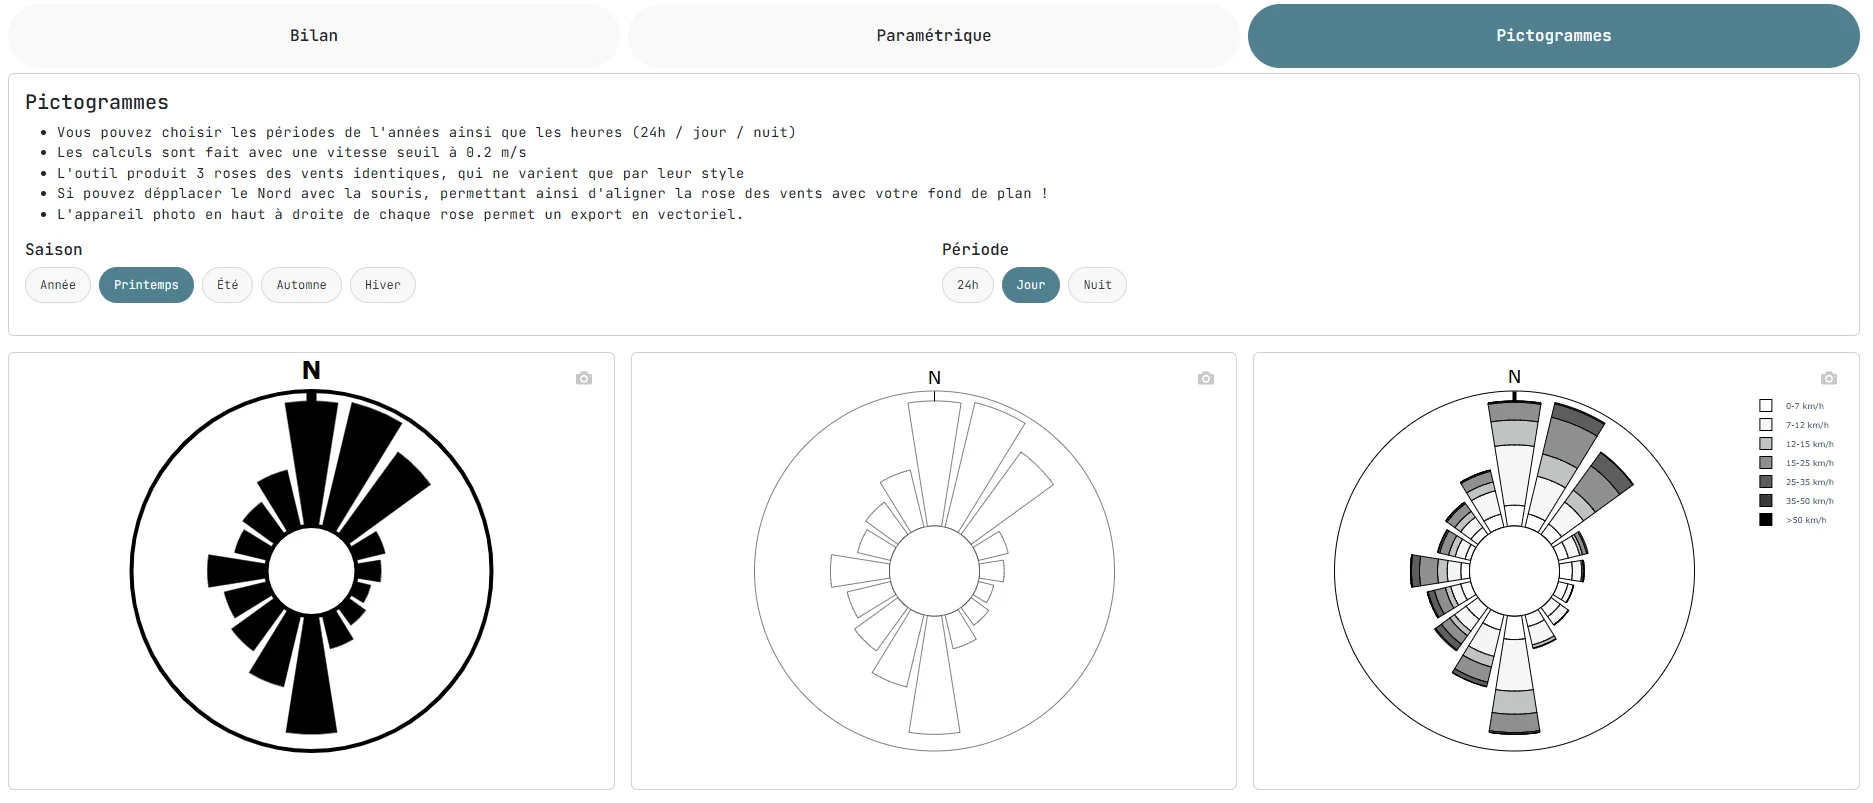
- Finally, a pictogram version provides a simplified representation, suitable for more synthetic or pedagogical outputs.
These different modes allow the analysis to be tailored to specific project needs.
📡 Data source
The data come from the Météo-France observation network, made available as open data on data.gouv.fr.
Dataset: Données climatologiques de base – horaires
543 French stations (metropolitan France and overseas territories) with at least 20 years of hourly data over the 2000–2024 period were retained, with a maximum gap of 6 months. The data correspond to hourly wind observations (speed and direction at 10 m) from the Météo-France surface network.
⚙️ Methodology
The analyses are based on hourly averaged data, measured at a standard height of 10 meters.
A threshold of 0.2 m/s is applied to filter out very low wind speeds, which are not significant for wind regime analysis.
When needed, vertical extrapolation can be performed using classical profiles:
- power law
- logarithmic profile (including surface roughness)
These approaches allow estimation of wind speeds at different heights, while relying on simplifying assumptions.
⚠️ Limitations
The results strictly represent measured conditions at the instrument location, at a height of 10 meters.
No correction is applied to account for local effects related to:
- surface roughness
- built environment
- topography
In addition, the use of hourly averaged data means that rapid variations and gusts are not represented. The tool is therefore not suitable for analyzing extreme winds, structural design, or detailed wind comfort assessment.
The vertical profiles rely on homogeneous assumptions regarding roughness and atmospheric stability, which may be significantly inaccurate in dense or complex urban environments.
🛠️ Implementation
This application is built in Python using the Dash-Plotly
framework.
The main libraries used are:
Dash Bootstrap Componentsfor layout and user inputs,Dash Leafletfor map visualization,PandasandNumPyfor data processing.