Wind Comfort
Users’ comfort in the wind is a concept that is still poorly understood and little studied, despite its influence on the feeling. In the following, we will detail the main steps and concepts necessary to understand it. This method has been implemented by the scientific community, and is used by the CSTB [Delpech, et al. 2005]1.
The quantification of wind comfort is thus based on local wind speeds in the presence of the building and on turbulence levels. CFD simulations make it possible to quantify the impact of the built elements through a nuisance grouping (detailed below) for each direction considered. These simulations make it possible to highlight protected areas, or on the contrary, to accelerate air flows.
In addition, in order to take into account all wind directions and different speeds, the notion of wind comfort statistically incorporates the complete meteorology of the year. The result is an overall frequency of discomfort, expressed as a percentage of annual time, during which the user will feel uncomfortable with the wind.
Finally, since the feeling of comfort is subjective (depend on the person, the clothing, the metabolic activity,etc.), these frequencies will be compared with the commonly accepted values by type of activity (sitting at rest, walking on foot, walking fast,etc.).
Wind, a turbulent phenomenon
Wind is a turbulent phenomenon. Thus, the speed of the latter at a point in the space can be represented by the graph in Fig. 1: an average speed value is observed \(\overline{u}\), and a random fluctuation \(u^\prime\) around this value (turbulence).
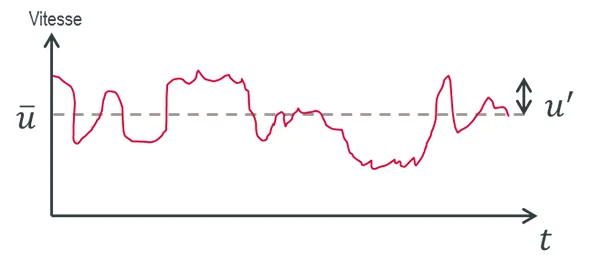
The “true” wind speed can therefore be decomposed as the sum of an average value and a turbulent fluctuation:
$$ u=\overline{u}+u^\prime $$Let \(\sigma_{\text{u}}\) the standard deviation of this fluctuation (measurement of the average deviation from the average value):
$$ \sigma_{\text{u}}=\sqrt{u^{\prime 2}} $$The intensity of the turbulence is then defined:
$$ I=\frac{\sigma_{\text{u}}}{\overline{u}} $$In general, this value is taken at a flat rate of 20%.
Nuisance groups
In order not to neglect any phenomenon, we will then focus as much on wind speed as on wind turbulence. The following grouping is therefore used as a representative of the annoyance effects:
$$ \overline{u}+u^\prime $$This grouping of nuisances is expressed in an infinite form by comparing it with the reference value that would be obtained in the absence of construction:
$$ \Psi = \frac{\overline{u}+\sigma_{\text{u}}}{(\overline{u}+\sigma_{\text{u}})\_{\text{ref},z}} = \frac{\overline{u}(1+I)}{\overline{u}\_{\text{ref},z}(1+I_{\text{ref},z})} $$If the presence of the construction accelerates air velocities, the nuisance grouping will be greater than 1, and conversely if the frame protects from the wind, this parameter will be less than 1. An example is given below, Fig. 2.
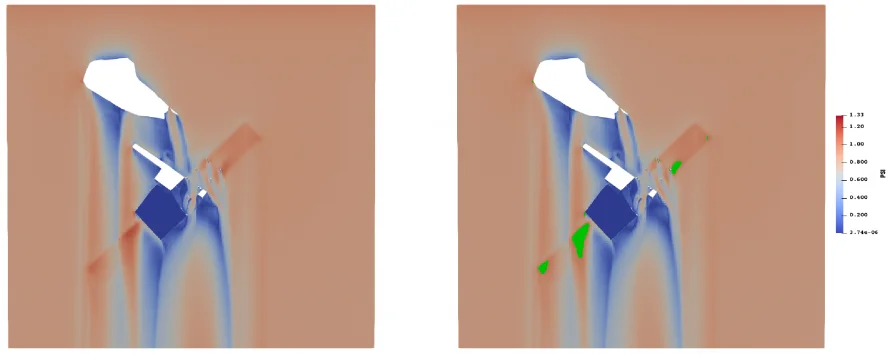
By studying amplification factor maps for all directions, problem areas and protected areas will be defined.
Discomfort threshold
In order to establish a hierarchy of wind effects, the Beaufort scale is used, which links speeds to the “visible” characteristics of the wind:
Beaufort scale / Wind speeds at \(z\) = 2 m
| Beaufort Number | Wind Speed [m/s] | Wind Speed [km/h] | Wind Characteristics |
|---|---|---|---|
| 2 | 1.5 - 3 | 5.4 - 10.8 | The faces feel the feeling of the wind. The leaves rustle. |
| 3 | 3 - 4.5 | 10.8 - 16.2 | The leaves and small branches are in constant movement. The wind fully unfurls the flags. The hair is disturbed. Loose clothing beats in the wind |
| 4 | 4.5 - 7 | 16.2 - 25.2 | Dust and papers are rising. The branches are shaking. The hair is tousled. |
| 5 | 7 - 9 | 25.2 - 32.4 | Small trees with leaves sway. Walking is slightly disturbed. |
| 6 | 9 - 11 | 32.4 - 39.6 | The large branches start to move. The wind is blowing in the telephone wires. Umbrellas are used with difficulty. Walking becomes very unstable. |
| 7 | 11 - 14 | 39.6 - 50.4 | The trees are totally in motion. It is very difficult to walk against the wind. |
| 8 | 14 - 17 | 50.4 - 61.2 | Tree branches break. In general, very difficult and dangerous pedestrian progress. |
| 9 | 17 - 20 | 61.2 - 72 | Risk of being violently thrown to the ground under the effect of gusts. |
The comfort threshold is defined as “the maximum permissible wind limit for staying in comfortable conditions”. It is usual to take as comfort threshold speed 3 m.s-1, corresponding to the transition between a wind numbers 2 and 3. Taking into account the flat-rate turbulence intensity of 20%, corresponding to that prevailing at ground level, in open countryside with open ground, the threshold speed is defined as follows:
$$ (\overline{u}+\sigma_{\text{u}})\_{\text{threshold}}=\left[ \overline{u}(1+I)\right]_{\text{threshold}} =3 \times (1+0.2) = 3.6 \text{ m.s$^{-1}$} $$Wind profile
In order to link the wind speed of the weather station to that at a selected height, the effects of altitude are taken into account. Thus, in each reference direction, the input velocity profile is a function of the height and roughness of the upstream terrain. For a given reference speed, the average wind speed at a height is expressed by the following relationship:
$$ \overline{u}(z)=c_{\text{r}}(z) \cdot \overline{u}_{\text{ref}} $$Where \(\overline{u}(z)\) is the average wind speed at an altitude \(z\), \(\overline{u}_{\text{ref}}\) is the reference speed at 10 m height (data from the meteorological station) and \(c_{\text{r}}(z)\) the roughness coefficient of the ground which allows to take into account the variability of the speed on the ground considered. The latter is calculated with the following relationship:
$$ c_{\text{r}}(z) = k_{\text{r}} \ln \left( \frac{z}{z_0}\right) \text{ if } z> z_{\text{min}} \text{ else } c_{\text{r}}(z_{\text{min}}) $$Where \(z_0\) and \(z_{\text{min}}\) are respectively a roughness height and a characteristic height depending on the terrain. Finally, the roughness coefficient \(k_{\text{r}}\) expresses itself:
$$ k_{\text{r}} = 0.19 \left( \frac{z_0}{z_{0,\text{II}}}\right)^{0.19} \text{ with } z_{0,\text{II}}=0.05 \text{m} $$All the values that this parameter can take are given in the [Eurocode 1 – 1.4]2 and are recalled in the table below:
Site category, according to the Eurocode 1.4:
| Site category | Description | Roughness length \(z_0\) [m] | Characteristic height \(z_{\text{min}}\) [m] | \(k_{\text{r}}\) value |
|---|---|---|---|---|
| 0 | Sea or coastal area | 0.003 | 1 | 0.16 |
| I | Lakes or flat, horizontal areas with negligible vegetation and free of obstacles | 0.01 | 1 | 0.17 |
| II | Low vegetation area (grass), with or without some isolated obstacles (trees, buildings) separated from each other by at least 20 times their height | 0.05 | 2 | 0.19 |
| III | Area with regular vegetation cover or buildings, or with isolated obstacles separated by no more than 20 times their height (village, suburban areas, forests) | 0.2 | 5 | 0.21 |
| IV | Area where at least 15% of the surface area is covered by buildings with an average height greater than 15 m | 1.0 | 10 | 0.23 |
Exceeding the discomfort threshold
By combining the above equations and formulas, it is possible to express the speed at an altitude as a function of the speed at 10 m height and the selected annoyance threshold:
$$ \overline{U}(z)>\overline{U^*}\_{\text{10m}}=\frac{3.6}{\Psi \cdot c_{\text{r}}(z)} $$Weibull distribution
When you look at a wind rose for a given site, you see all wind directions over the year. After setting an angular discretization, we can also look at the distribution of speed occurrences by direction. For this purpose, a frequency distribution of occurrences is used. An example is given below for a given wind direction:
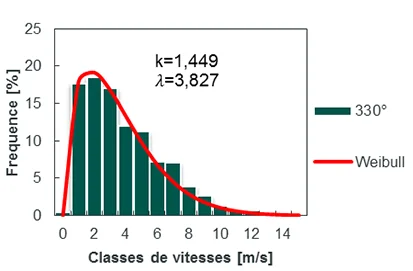
In order to process this information statistically, these histograms are described with a Weibull probability density function which is continuous:
$$ f(\overline{u},k,\lambda)=\frac{k}{\lambda} \left(\frac{\overline{u}}{\lambda}\right)^{k-1} \exp \left[ -\left( \frac{\overline{u}}{\lambda}\right)^k\right] $$where \(k\) and \(\lambda\) are respectively the shape parameter (dimensionless) and the scale parameter (in m.s-1). These two parameters are then calculated for each direction, using the equivalent wind power method [Carrillo et al., 2004]3. An example is shown in Fig. 3 above, with a red continuous line.
By then working with frequency distributions cumulated, we obtain the probability that the speed in one direction \(\theta\) is greater than a fixed value \(\overline{U^*}_{\text{10m}}\):
$$ P_{D,\theta}\left( \overline{U} \gt \overline{U^*\_{10\text{m}}} \right) = \exp \left[ -\left(\frac{3.6}{\Psi K(z)\lambda} \right)^k \right] $$Finally, the probability of exceeding the annual annoyance threshold (or more simply annoyance frequency) takes into account all directions, with their frequency (defined by the wind rose):
$$ P_D \left( \overline{U} \gt \overline{U^*\_{10\text{m}}} \right) = \sum\_{\theta} f\_{\theta} P_{D,\theta} \left( \overline{U} \gt \overline{U_{10\text{m}}^\star} \right) $$This value therefore represents, at each point, the real exposure to the wind, representative of what the user feels throughout the year. It should then be compared with the commonly tolerated gene frequencies presented in the table below.
| Activities | Upper limit of frequency for adequate comfort (% of annual time) |
|---|---|
| Prolonged stationary situation Coffee terrace, open-air theatre, swimming pool, etc. | < 2% |
| Short-term immobile situation Public garden, playground, shopping street, gallery, etc. | 5% |
| Normal walking Walking tour, pedestrian crossing, building entrance, etc. | 10% |
| Fast walking Car park, sidewalk of avenues, belvederes, etc. | 20% |
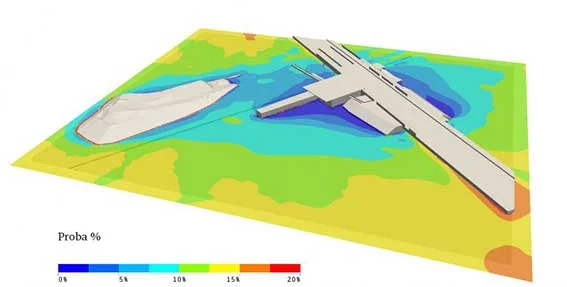
The mapping of this probability at man’s height makes it possible to prejudge areas that will be more or less comfortable over the entire year. An example is given below.
Delpech, P., Baker, C. J., Blackmore, P. A., Koss, H., Sanz-Andres, A., Stathopoulos, T., & Willemsen, E., 2005, Pedestrian wind comfort assessment criteria: A comparative case study. Proceedings of 4EACWE, Prague PDF link ↩︎
NF EN 1991-1-4 Eurocode 1: Actions on structures - Part 1-4: General actions - Wind actions PDF link ↩︎
Carrillo, C., Cidrás, J., Díaz-Dorado, E., & Obando-Montaño, A. F., 2014, An approach to determine the Weibull parameters for wind energy analysis: The case of Galicia (Spain). Energies, 7(4), 2676-2700. PDF link ↩︎