 L'hypercube
Heatwaves
The terms heat spike, heatwave, and canicule are often treated as synonyms. They nevertheless describe different phenomena, and no universal scientific definition of a heatwave exists. Relevant thresholds depend on the local climate, the population, and the purpose of the analysis: climatology, public health, thermal comfort, or building resilience.
Heat spike, heatwave, and canicule
Météo-France distinguishes between:
- a heat spike, a brief period of 24 to 48 hours that is markedly warmer than normal;
- a heatwave, several days of abnormally high temperatures, notably characterised at the national scale by climatological criteria;
- a canicule, very high daytime and night-time temperatures over a prolonged period, presenting a health risk assessed at departmental level.
A climatological detection method is therefore not the same as the system used to trigger France’s heatwave warning level.
Source: Météo-France — Canicule, heat spike or heatwave: what is the difference?
Definitions suited to the purpose
Health-based approaches
Some definitions directly relate heat to health impacts. Robinson’s method1, for example, uses the Heat Index, calculated from air temperature and relative humidity, with thresholds associated with heat stress.
Climatological approaches
Other methods define heatwaves relative to the temperature distribution of the local climate. A temperature that is exceptional in a cool region may therefore qualify as extreme even if it is common elsewhere. Ouzeau et al.2 use this principle in the method employed at L’hypercube to analyse climate series.
Heatwave thresholds in France
There is no single nationwide threshold for France’s heatwave warning system. Météo-France and Santé publique France use department-level biometeorological indices, notably based on minimum and maximum temperatures averaged over three rolling days and the local population’s sensitivity to heat.
In Toulouse, for example, Météo-France indicates that conditions may be considered a canicule when maximum temperatures exceed 36°C and minimum temperatures exceed 21°C for three days and three nights. These thresholds inform decisions, but the warning level also reflects other factors and forecaster expertise.
Source: Météo-France — What is the heatwave warning system?
A national climatological definition
To characterise heatwaves across France, Météo-France uses a national thermal indicator calculated from daily minimum and maximum temperatures at 30 stations.
A national heatwave is identified when:
- the indicator reaches 25.3°C for at least one day;
- it remains at or above 23.4°C for at least three days.
The event ends after three days below 23.4°C, or immediately after a single drop below 22.4°C. This definition provides a consistent chronology since 1947.
Detecting a heatwave in a climate series
The Ouzeau et al. method2 uses three thresholds derived from the distribution of daily temperatures over a reference period:
- $S_{pic}$: 99.5th percentile;
- $S_{deb}$: 97.5th percentile;
- $S_{int}$: 95th percentile.
$S_{pic}$ triggers event identification. Its beginning is found by working backwards to the first day above $S_{deb}$. The event ends after at least three days below $S_{deb}$ or after a single drop below $S_{int}$, which marks a genuine interruption.
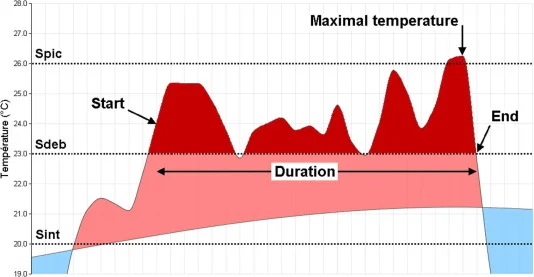
Source: Ouzeau et al.
Duration, intensity, and severity
A heatwave is described by its duration, intensity, and severity. Severity combines duration with the amount by which temperatures exceed the threshold:
$$ \text{Severity} = \frac{\sum_i (T_i - S_{\mathrm{deb}})}{S_{\mathrm{pic}} - S_{\mathrm{deb}}} $$where $T_i$ is the temperature at each time step during the event.
Heatwaves observed in France
By summer 2026, Météo-France had identified 54 national heatwaves since 1947: 17 before 2000 and 37 since the beginning of the twenty-first century.
Three occurred in 2026: 17–30 June, 4–19 July, and 28 July–19 August. The last lasted 23 days, matching the July 1983 event. Other notable episodes include August 2003, July 2019, and the successive heatwaves of 2022.
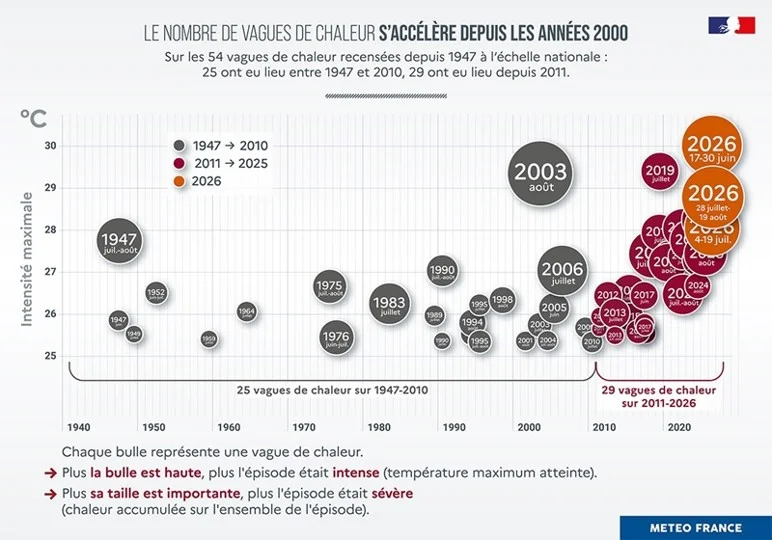
More frequent and severe heatwaves
Observations show more frequent events and a longer hot-weather season. Projections indicate increasing frequency, duration, and intensity as warming increases. In a France that is 4°C warmer, the TRACC reference level for 2100, events that are exceptional today will become much more common.
Source: Météo-France — the impact of climate change on heatwaves
Detecting heatwaves in climate projections
The statistical method can also be applied to projections. Machard et al.3 used it on several decades of EURO-CORDEX data from three models to identify and rank heatwaves and construct weather files for building thermal simulation.
Their Python code is available on GitHub .
Constructing a future heatwave for simulation
One possible approach is to select a time horizon or warming level and an ensemble of projections, detect their heatwaves, calculate their characteristics, and then select or reconstruct a representative event within a consistent hourly series.
The tested level must be explicit: a median event, a severe but plausible event, a given quantile, or several successive levels. This approach is generally more informative than automatically selecting the “worst year”.
TMY, AMY, and heatwave files: which file answers which question?
| File type | Main question | Typical use |
|---|---|---|
| Current TMY | How does the project perform in the average current climate? | Energy, typical comfort, system sizing |
| AMY | How would it have performed during an observed year? | Historical events, validation |
| Future TMY | How does it perform in an average future climate? | Adaptation, energy use, and comfort |
| Future heatwave file | Does it remain robust during a plausible future extreme? | Resilience, overheating, passive strategies |
These files complement one another: average climate describes routine operation, while extreme events test the project’s limits.
Robinson, P.J. On the definition of a heat wave. J. Appl. Meteorol. 2001, 40, 762–775. Article ↩︎
Ouzeau, G., Soubeyroux, J.M., Schneider, M., Vautard, R., Planton, S. Heat waves analysis over France in present and future climate: Application of a new method on the EURO-CORDEX ensemble. Climate Services, 2016, 4, 1–12. Article ↩︎ ↩︎
Machard, A., Inard, C., Alessandrini, J.M., Pelé, C., Ribéron, J. A Methodology for Assembling Future Weather Files Including Heatwaves for Building Thermal Simulations from the European Coordinated Regional Downscaling Experiment (EURO-CORDEX) Climate Data. Energies 2020, 13(13), 3424. Article ↩︎