 L'hypercube
Observed climate and weather
Current climate and past weather situations can be described using weather-station measurements, model outputs, reanalyses, or synthetic files. These sources differ in their origin, resolution, and representativeness.
Weather measurements
A weather station measures air temperature, pressure, wind, humidity, dew point, precipitation, cloud cover, and visibility at a given location. Solar radiation is measured less often, although it is essential for building thermal simulations.
A station’s instruments depend on its purpose: climatology, aviation, agriculture, or road weather. National networks share some observations with the World Meteorological Organization . Stations generally have a WMO number and, in aviation, an ICAO code.
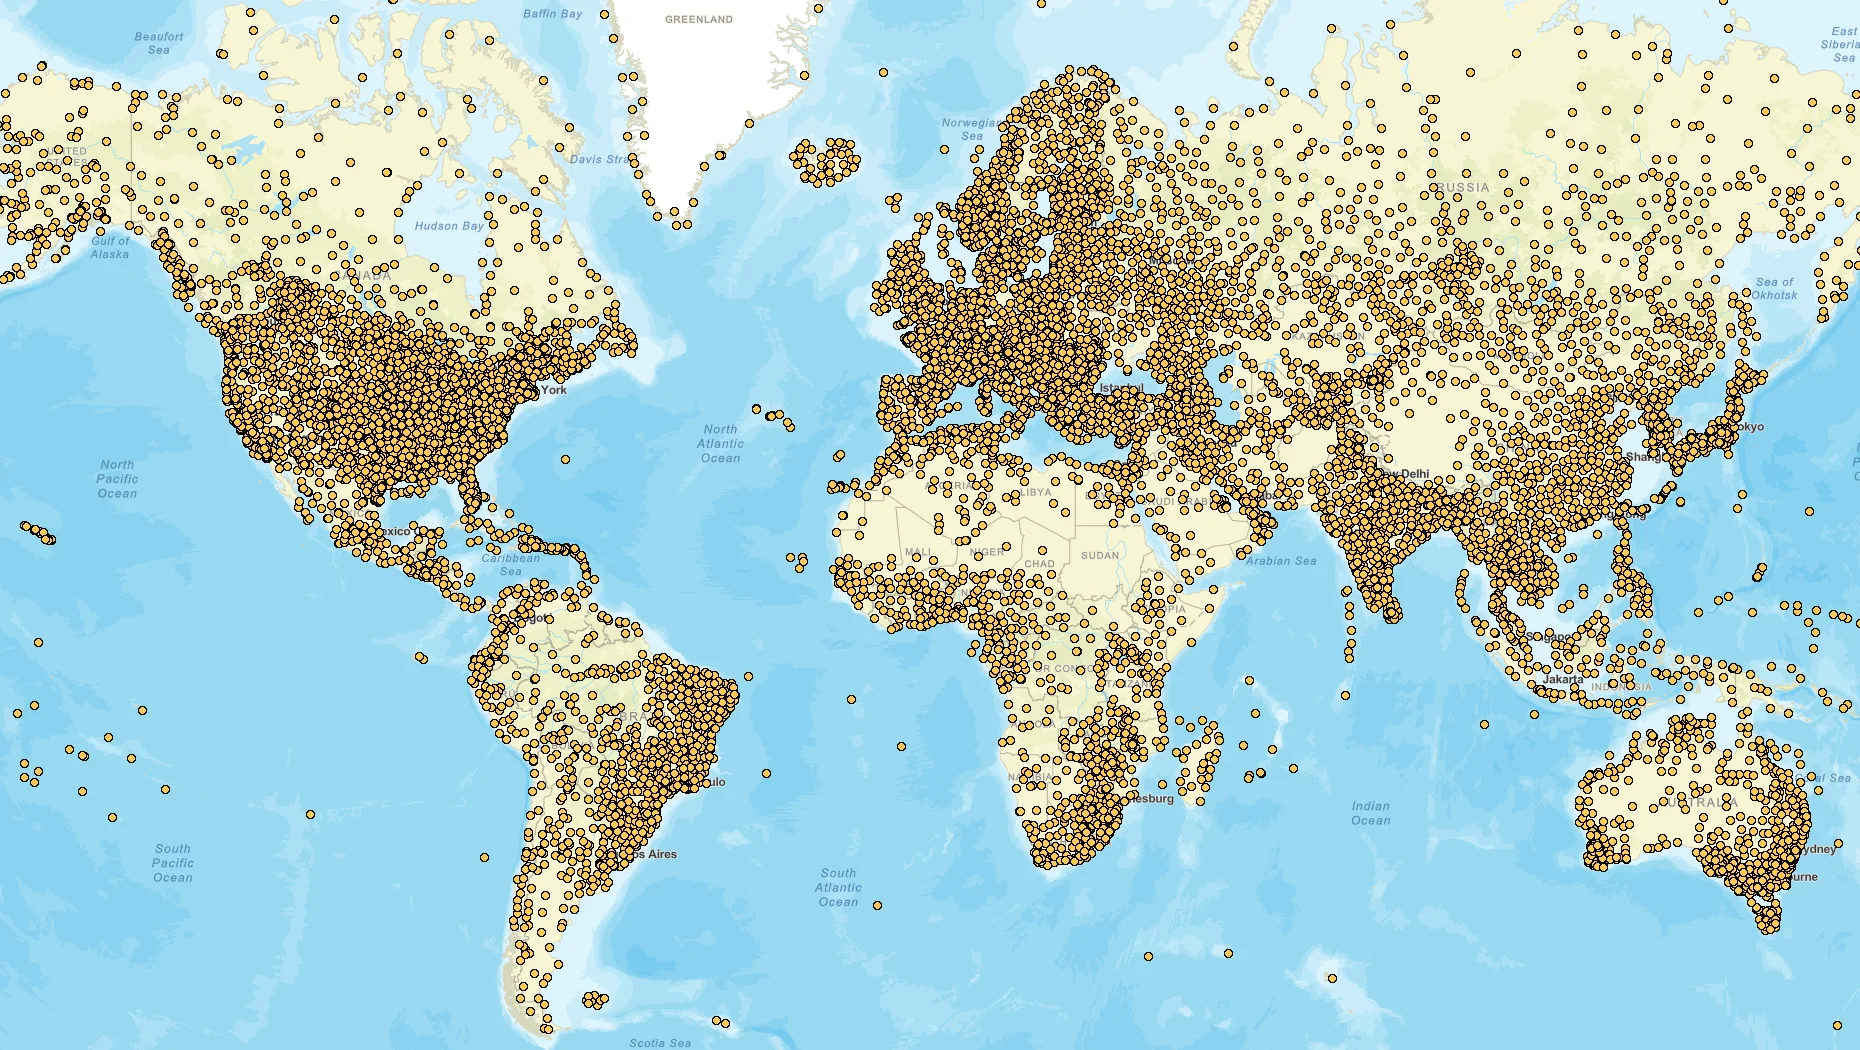
Source: NCEI/NOAA
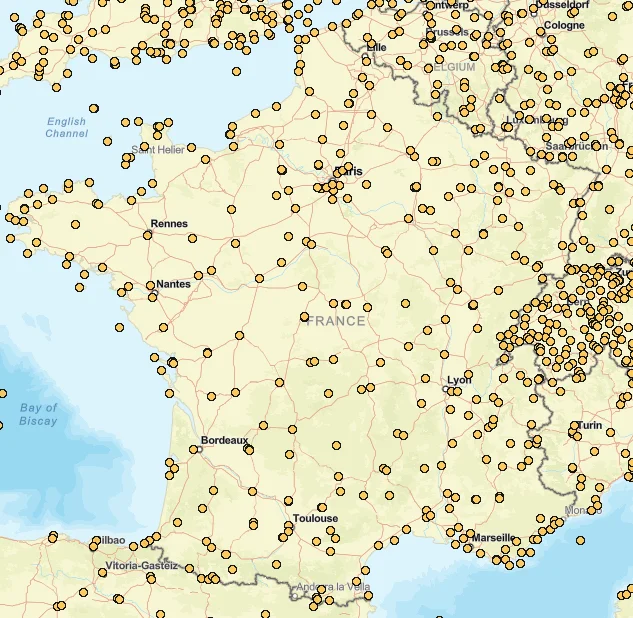
Source: NCEI/NOAA
Data sources
- Météo-France for observations in France;
- NOAA/NCEI for numerous observations worldwide;
- Meteostat for convenient access to historical hourly or daily observations from different networks.
A station provides a local measurement. It may not represent conditions at a distant site, particularly when relief, urbanisation, or distance from the sea differs.
Forecasting the weather
A weather forecast starts from the state of the atmosphere and predicts its short-term evolution. Climate describes its statistical properties over long periods. Numerical models solve the equations governing the atmosphere on a grid whose resolution is suited to the phenomena being studied.
From global to local
Higher-resolution models can be nested in global models to represent regional and local phenomena more accurately.
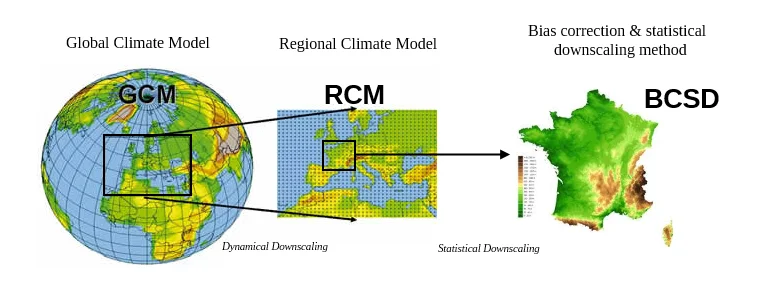
Source: DRIAS
Two main families of methods are used:
- dynamic downscaling, based on a high-resolution physical model, which maintains consistency between variables but is computationally expensive;
- statistical downscaling, which relates large-scale conditions to local observations at a lower computational cost, but may introduce artefacts.
At L’hypercube, WRF (Weather Research and Forecasting) is used for applications requiring fine-resolution weather modelling.
Reanalyses: reconstructing past climate
A reanalysis combines an atmospheric model with numerous historical observations through data assimilation. It reconstructs the atmosphere on a regular grid over several decades, providing continuous spatial coverage, homogeneous time series, and many variables.
It is not a direct observation: this model result, constrained by measurements, may retain biases, particularly for highly local phenomena.
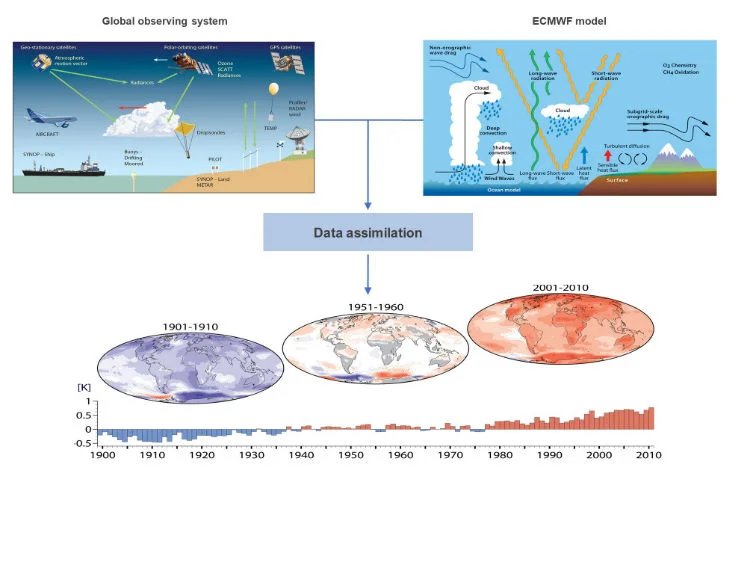
Source: ECMWF
ERA5
ERA5 is a global reanalysis produced by ECMWF. It provides many atmospheric variables over several decades. ERA5-Land offers a finer reconstruction of land-surface variables.
Hourly weather files
Thermal, energy, and comfort studies often use a full year of hourly data. The file may represent an average climate or an actual year.
Typical Meteorological Year — TMY
A TMY is a synthetic year representative of the climate at a location over several decades. Its months may come from different years selected to reproduce the statistics of the reference period.
TMY files suit energy studies, routine system sizing, and typical comfort assessments. Files are available from Climate.OneBuilding.org , among other sources.
At AREP, the TMY files used in studies mainly come from Meteonorm .
Available variables
| Variable | Unit | Information |
|---|---|---|
| Air and dew-point temperatures | °C | — |
| Relative humidity | % | — |
| Atmospheric pressure | Pa | — |
| Global, direct, and diffuse solar radiation | Wh/m² | — |
| Global, direct, and diffuse illuminance | lux | — |
| Wind direction and speed | ° from North, m/s | North: 0°, East: 90° |
| Cloud cover | tenths | 0: clear; 10: overcast |
| Visibility | km | — |
| Precipitation | mm | — |
| Albedo and aerosols | — | Depending on the format |
Limitations of typical years
Because a TMY represents average climate conditions, it does not accurately reproduce rare events. A severe heatwave may be absent even though it is decisive in a resilience study.
Actual Meteorological Year — AMY
An AMY represents an observed or reconstructed year. Several datasets may be combined when a variable is missing; solar radiation, for example, may be reconstructed using a model or reanalysis.
AMY files can reproduce a historical event, compare simulations with measurements, or study a particularly hot summer. Resimulating a building with the 2003 weather is a common resilience-analysis case.
What about extreme events?
An extreme event is not defined by a maximum value alone: duration, intensity, geographical extent, and cumulative severity also matter. Heatwaves, which are important for comfort and resilience, are covered on the Heatwaves page.