Coupling BES / CFD for natural ventilation
Why ?
In Building Energy Simulation (BES) softwares, pressure coefficients are generally given by correlations according to the angle of incidence and the shape of the building [Swami & Chandra 1988]1 or tabulated values that are unsuitable for most real-life situations: for example, Figure 1 below shows the values used by some BES softwares to determine the pressure coefficients \(C_{\text{p}}\).
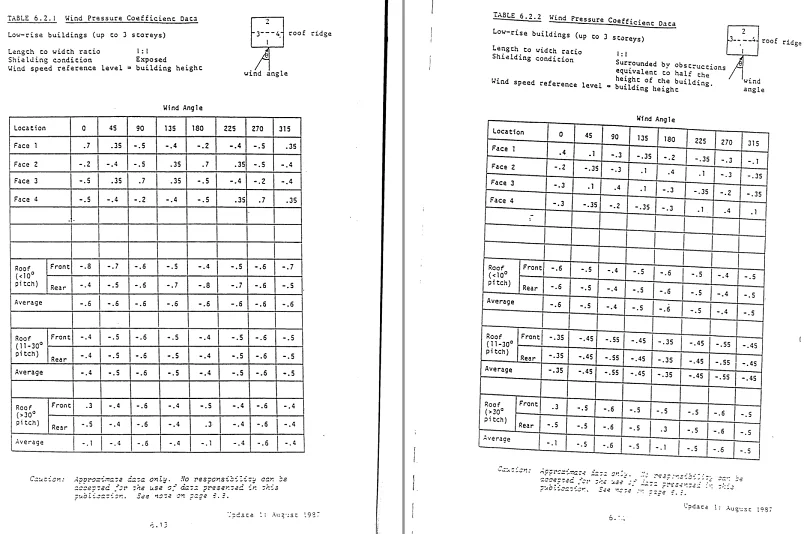
The calculated natural ventilation flows are therefore very likely to be incorrect if they are estimated from the default values (see also our article on reducing uncertainties in natural ventilation).
The workaround
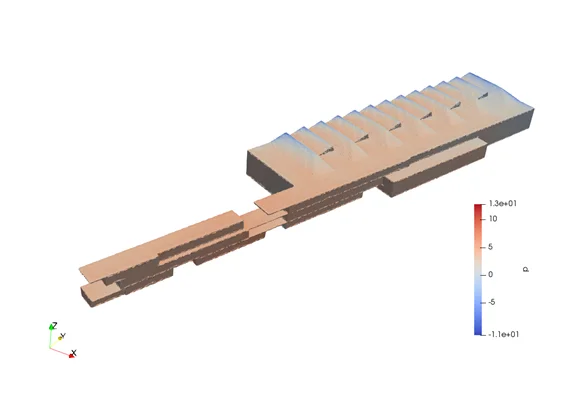
First, the pressure coefficients per façade element must be computed, depending on the wind orientation and magnitude (an illustration of the pressure field on a building is given in Figure 2).
Each pressure coefficient must then be assigned to the correct façade element. To achieve this, we go through
the file defining the BES problem (*.idf files in EnergyPlus) and replace the pressure coefficient for each
opening and each wall, in order to calculate the flow rates related to infiltrations.
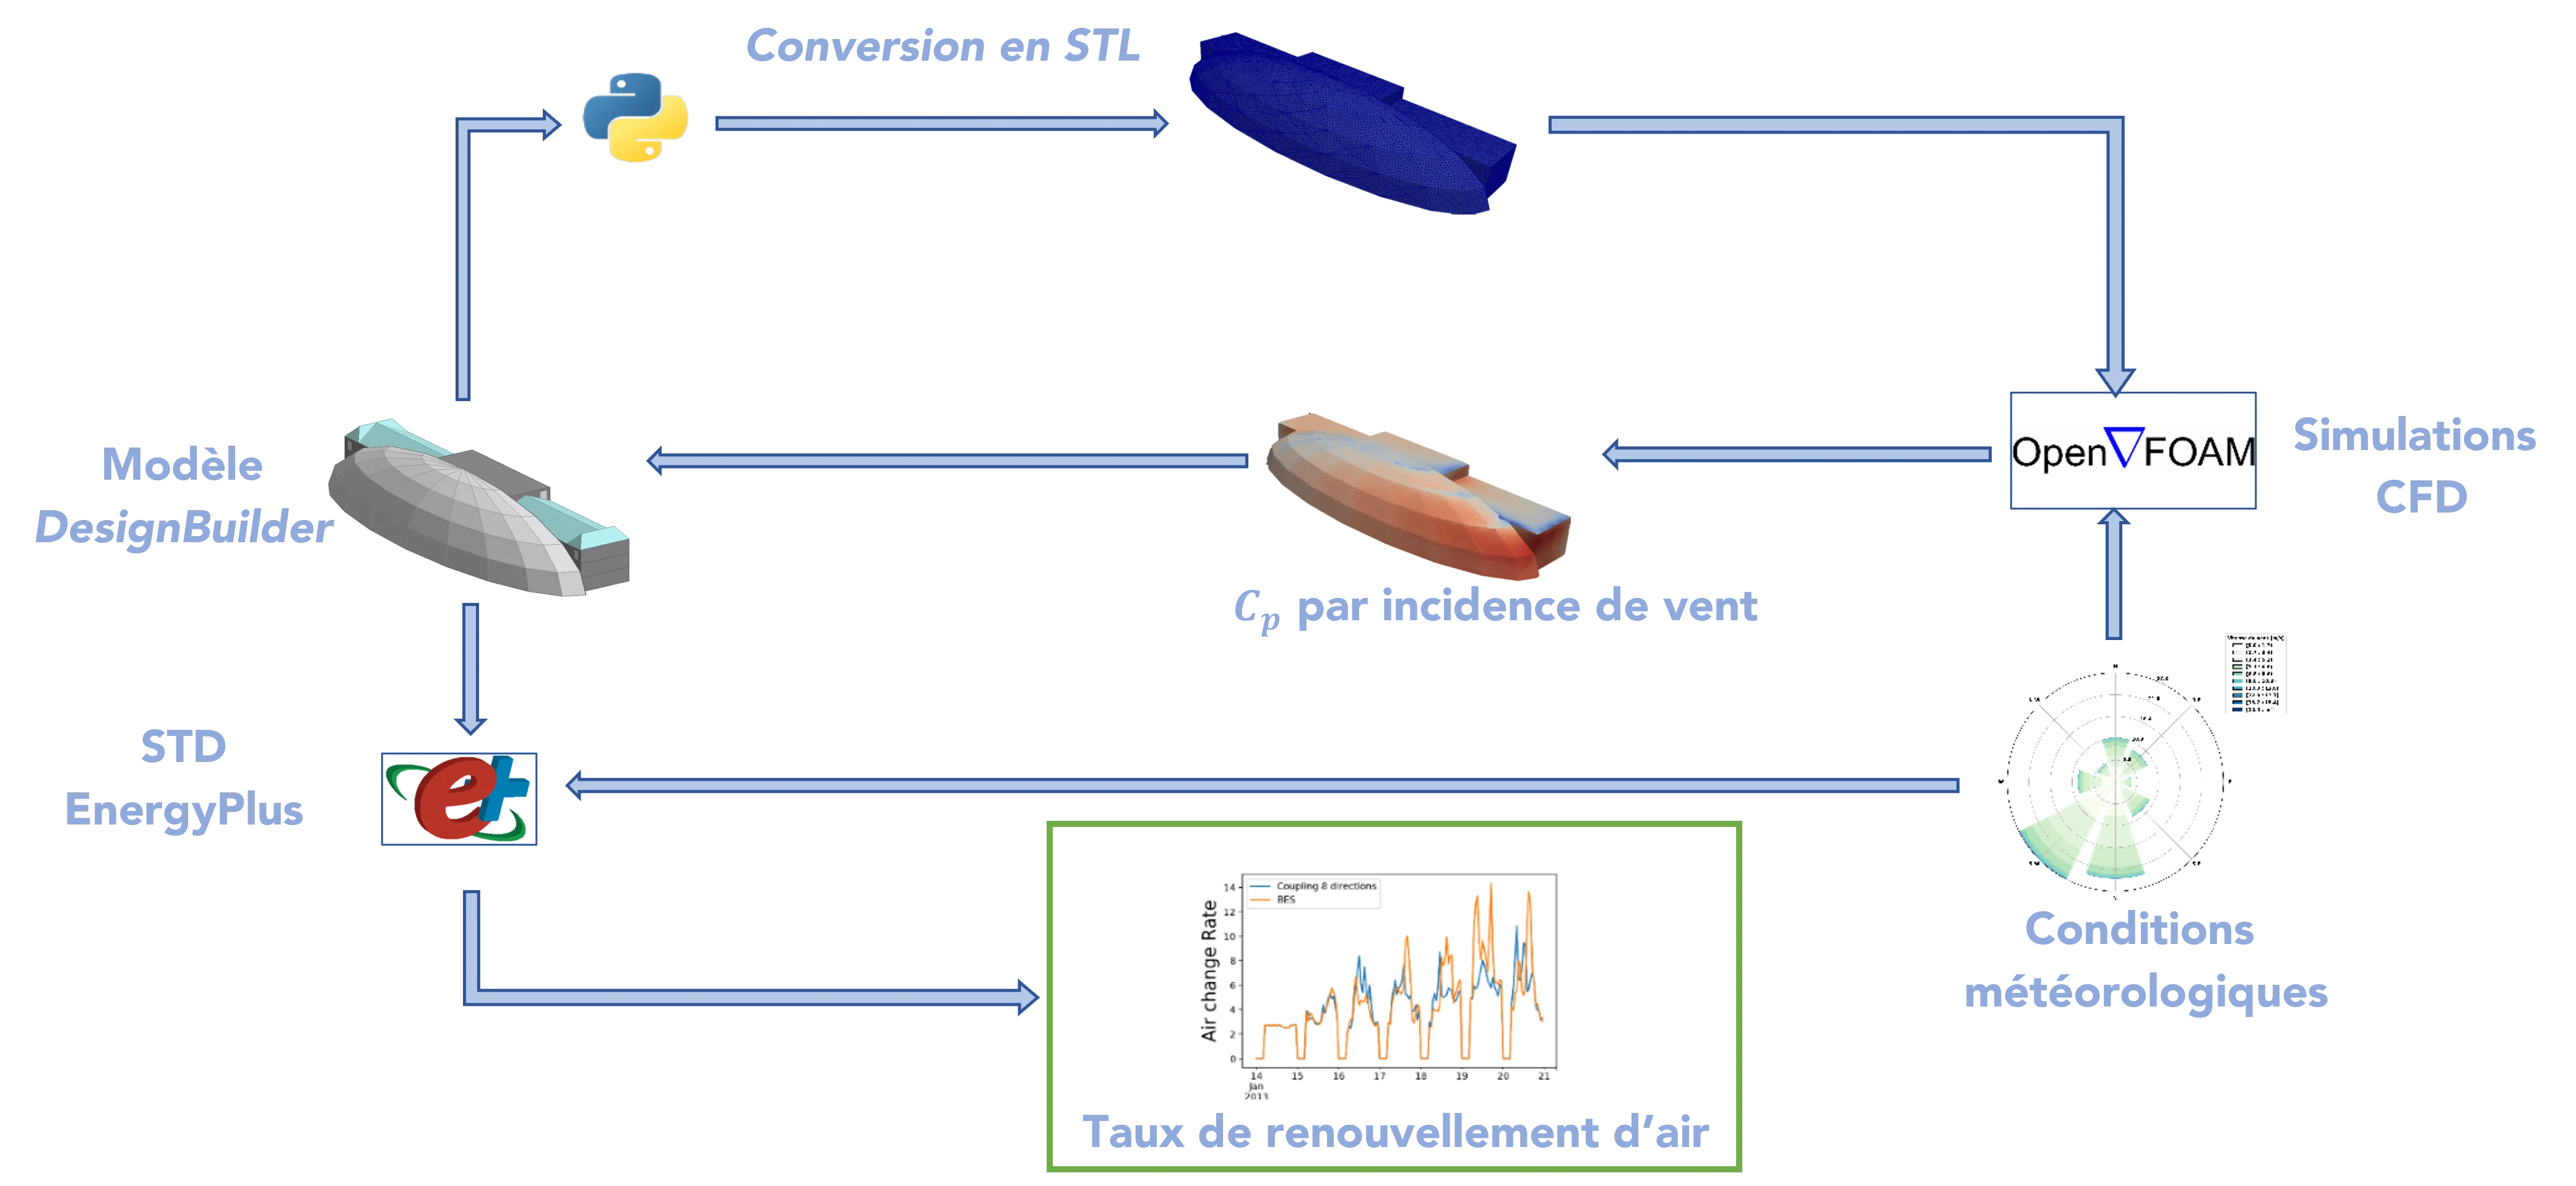
This technique has two main advantages:
- Compared to a direct use of the flowrates computed with CFD, this preserves the thermal buoyancy effects related to the temperature difference between inside and outside.
- The number of pressure coefficients per wind direction is increased: by default they are given every 45°, while we take a maximum of 30 °.
The question that arise is then: how many wind directions should we simulation for a better prediction of wind-induced natural ventilation? Next section gives an insight about this topic.
Influence of angular discretization
Figure 4 below shows the natural ventilation rate in a largely glazed train station atrium. The different lines plotted correspond to an increasing number of wind directions simulated: for instance “4 directions” means one simulation is done every 90° and “24 directions” means one simulation every 15°.
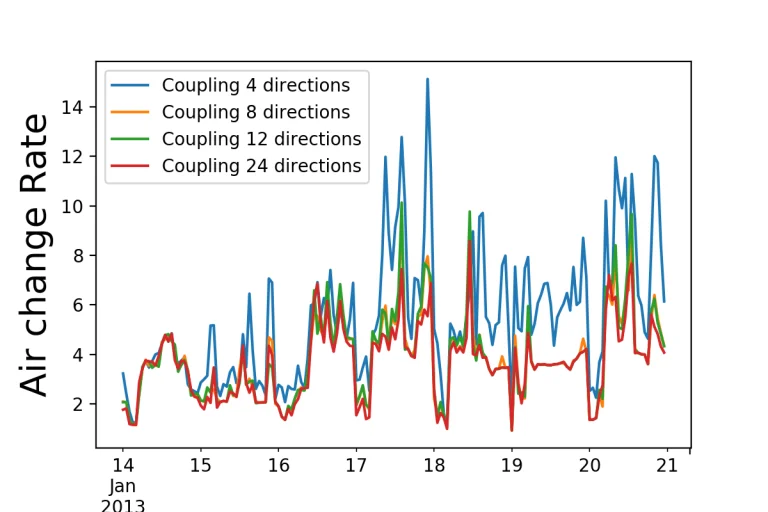
One can see that from 8 directions (i.e. \(\Delta\theta\) = 45°), the differences tend to decrease. The error gap between 12 and 24 simulations is relatively low, which in the presented context would advocate for only 12 CFD simulations. A more thorough quantitative analysis is available in one of our publication in the Techniques de l’Ingénieur website .