Nodal Approach Enrichment
Why ?
The information given by building energy simulation is nodal, i.e. for each “zone” defined in the building, the heat and mass balances can only determine one scalar quantity. While this approach is suitable for offices, dwellings and other low-rise volumes that are reasonably glazed and open to the outside, in very open and glazed spaces, this quantity of information is insufficient for the characterization of comfort.
Indeed, in BES, the incident solar fluxes in the area are generally distributed over the different opaque surfaces without conserving the information of the actual flux distribution or, in the most simplistic models, completely sent to the ground.
The estimation of the value of the air velocity field value is not made and a low arbitrary value is used for the calculation of comfort (e.g. \(v\) = 0.13 [m/s] for EnergyPlus).
The limitations of this approach lead us to propose an alternative, enriching the BES for a spatial prediction of thermal comfort.
Proposed method
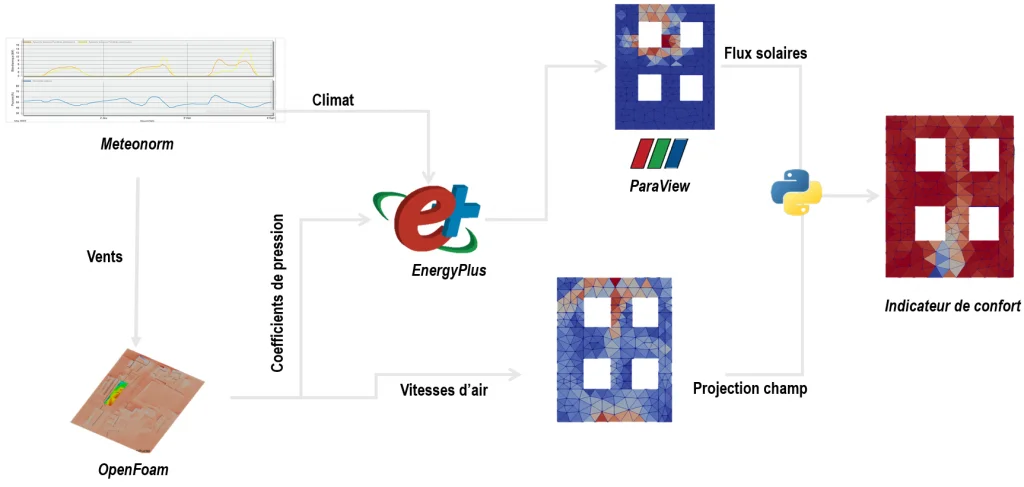
The challenge relies in obtaining several fields and scalars allowing the calculation of comfort. Following elements are hence successively determined:
- The pressures on the facades are calculated by a CFD approach and assigned to the walls & openings in the building energy simulation model (see the dedicated page ),
- The air velocity field for each wind direction are extracted from the 3D field as 2D slices at occupancy height in the area of interest,
- The distribution of the indoor solar fluxes is obtained, for example with Radiance ,
- Air temperatures and relative humidity are retrieved from the building energy simulation.
It is then necessary to project on a common mesh the fields obtained by the different tools (on this subject see the article in the section Numerical Methods ).
After projection, the level of comfort can be calculated, based on a comfort indicator adapted to the environment studied ( read more ). An illustration of the principle is provided in the form of a synoptic in Figure below.
One should nevertheless be cautious when using the values obtained: several dozen uncertainties have been identified in BES [Garnier et. al, 2015] , all of which may have a significant impact on the results. A reasonable approach is hence to work with relative values, preferring to compare trends or differences between simulated constructive variants rather than absolute values.
Post-rocessing the results
The approach developed above gives hourly comfort maps over a year’s period. A quick calculation shows that such simulations produce more than 4 million data that need to be processed intelligently: indeed, if the objective of the method is to go beyond the “average value approach”, it thus seems absurd to recalculate spatial time step averages. A clever use of the data is to be made.
The first operations that come to mind are time averages. Using the \(N\) simulated hours, it becomes easy to average comfort over time, for example over the opening hours of a station, the hottest week, or for the hours of the night in autumn, etc. The possibilities are endless! In practical terms, the averages used will depend on the issues at stake in the study and the question being asked.
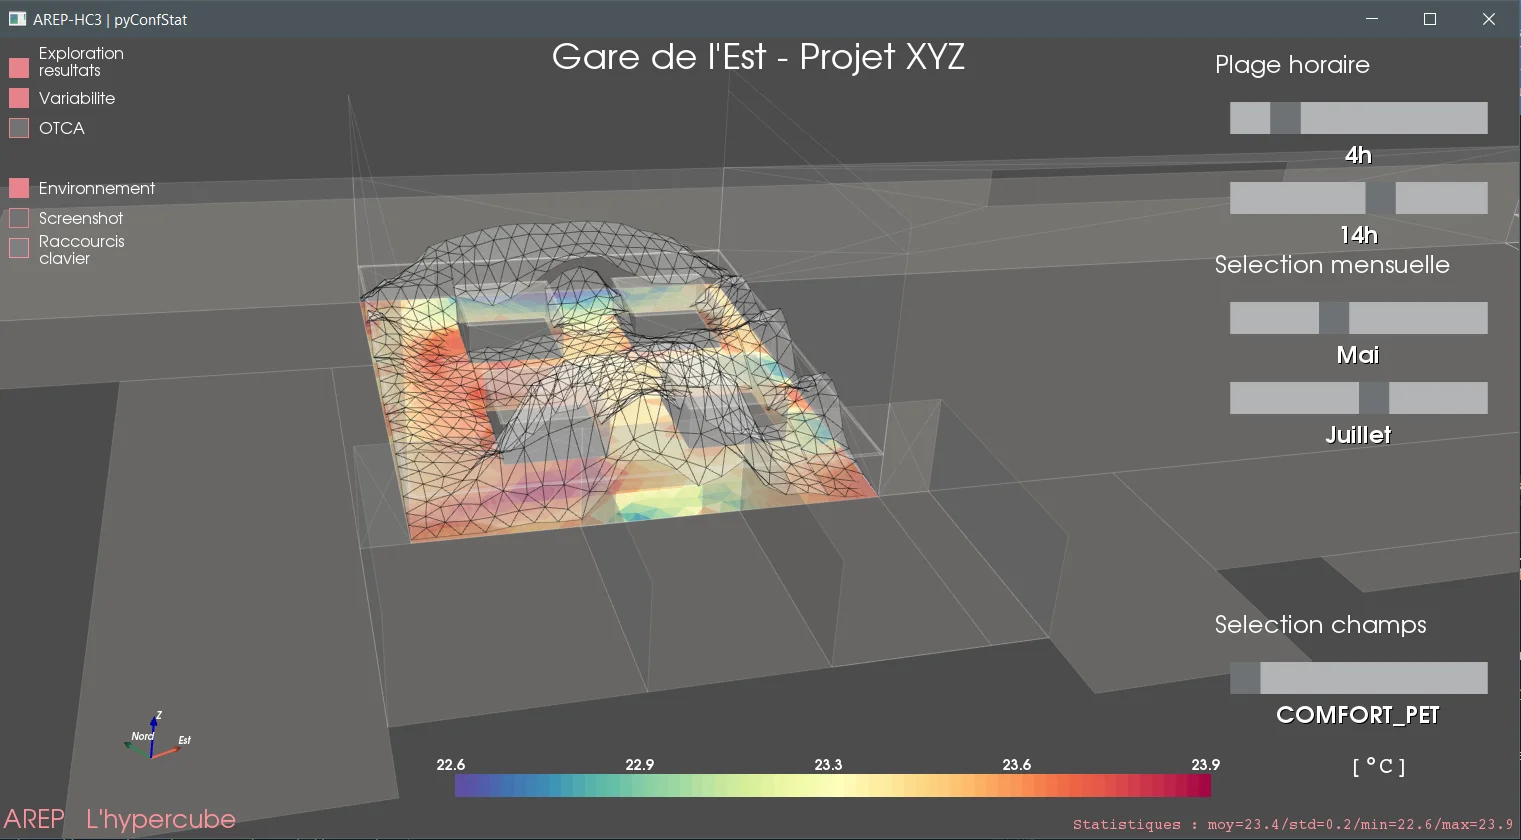
In order to explore these results in a more interactive way, we have developed a tool (which we hope will soon
be open-sourced) that enables us to produce these statistics on the fly (on hourly VTK files), by selecting
dates, start/end times, physical quantities (solar radiation, air speed, comfort, temperature) and displaying
the associated averages and variabilities.
Another of the available tools to represent the spatial variability of comfort is the OTCA (Outdoor Thermal Comfort Autonomy) [Nazarian et al., 2019] for the chose thermal comfort index \(\varphi\). We first compute\(\sigma\) such that:
$$ \sigma = 1 \text{ si } \varphi \in [\varphi_{\text{min}}, \varphi_{\text{max}}]^{\text{comfort zone}} $$$$ \sigma = 0 \text{ si } \varphi \notin [\varphi_{\text{min}}, \varphi_{\text{max}}]^{\text{comfort zone}} $$Then, for the number of hours of occupancy, \(N\), it becomes possible to assess this index mean value for every point.
$$ \text{OTCA} = \frac{1}{N} \sum_{1}^{N}\sigma $$This general approach was used presented more into details in 2 conferences, at IBPSA 2020 and IBPSA 2021 :