Natural ventilation and BES
With the improvement of the building envelope performance, the effects of wind on natural ventilation have an increasing share in energy consumption. In building energy simulation, these effects are poorly modelled compared to reality: this phenomenon can be significantly improved by the use of numerical simulation.
Calculation principle of natural ventilation in BES
To illustrate the point, this section presents a simple case of natural cross ventilation related to wind effects only. The current BES tools determine the cross draught between two openings \(a\) and \(b\) at a height \(z\) using Bernoulli’s theory :
$$ Q_{\text{v}} = S_{\text{eq}} \times v(z) \times \sqrt{C_{\text{p}}^a − C_{\text{p}}^b} $$where \(v(z)\) is the wind speed at a height \(z\) and \(C_{\text{p}}\) is the pressure coefficient of each facade considered. The equivalent surface area \(S_{\text{eq}}\) is a weighted average of the surfaces of the opening frames and their discharge coefficients, so that :
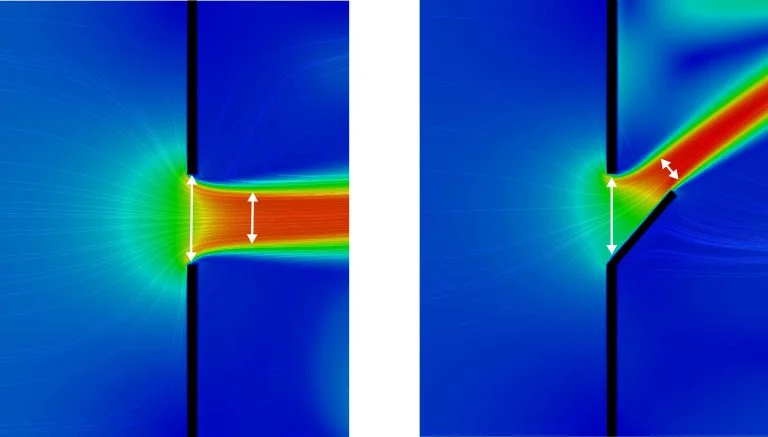
$$ \frac{1}{S_{\text{eq}}^2} = \frac{1}{\left(C_{\text{d}}^a S_a \right)^2} + \frac{1}{\left(C_{\text{d}}^b S_b \right)^2} $$where \(S_a\) and \(S_b\) represent the respective surfaces of openings \(a\) and \(b\). The discharge coefficients, \(C_{\text{d}}\), of the same openings represent two phenomena that reduce the theoretical flow rate, Bernoulli principle assuming that the fluid has a zero viscosity. On the one hand, the vein contracts after opening due to the inertial effects of the jet hence decreasing the flow rate by a coefficient \(C_{\text{c}}\) equal to the ratio between the surface of the vein after the passage of the opening and the offered passage surface (see Figure 1 for two simplified forms of openings). On the other hand, viscous friction reduces the flow rate, which is represented by a \(C_{\text{f}}\) factor generally between 0.95 and 0.99. The discharge coefficient is therefore the product \(C_{\text{d}} = C_{\text{c}} \times C_{\text{f}}\). The value commonly accepted by the standard [ASHRAE, 1997]1 and several natural ventilation calculation softwares (CONTAM, IES-VE MacroFlo, EnergyPlus) is in the range of 0.60 to 0.65.
Since there is no direct access to the stagnation pressure at the opening or to the pressure difference between the façades openings \(a\) and \(b\), a pressure coefficient \(C_{\text{p}}\) for each façade is introduced: it represents a fraction of the dynamic pressure “far from the obstacle” in the undisturbed flow, and can be positive or negative in the event of overpressure or depression:
$$ C_{\text{p}} = \frac{p_{\text{facade}}}{\frac{\rho \times v_{\text{ref}}^2}{2}} $$where \(p_{\text{facade}}\) is the stagnation pressure on the facade, \(\rho\) the density of the air and \(v_{\text{ref}}\) the reference velocity.
Depending on the software, the coefficient \(C_{\text{p}}\) is approximated by following valid empirical correlations for rectangular geometries with a shape factor close to unity, including a correction for wind angle of incidence with sometimes a distinction for high-rise buildings [Swami & Chandra, 1988]2, [Akins, Peterka & Cermak, 1979]3.
The undisturbed flow velocity \(v_{\text{ref}}\) is taken equal to the one of the nearest weather station. In order to determine the air speed throuh the opening frame at height z, an atmospheric law such as the one describe hereafter is applied.
$$ v(z) = v_{\text{ref}} \times k_0 \times \ln\frac{z}{z_0} $$To represent the building environment, the profile of this atmospheric boundary layer equation can be modified by the coefficients \(k_0\) and \(z_0\), respectively the roughness of the site, between 0.14 and 0.25 and the roughness length, between 0.5 mm and 2 m, depending on whether the site is very open (sea, snowfield, sandy desert) or very rough (centre of megacities, tropical forest).
Reveiw of the model
The complexity of building facades, their location in the urban environment or the shape of the openings create a reality that is often far from the theory exposed in the preceding section. In the following, we will try to show the extent of the possible deviations on different parameters of the modeling.
Discharge coefficient
The coefficient \(C_{\text{d}}\) is a quantity that is generally poorly documented by manufacturers because it varies according to factors such as the opening rate of the orifice, the difference in indoor/outdoor temperature, the air velocity, as identified in the bibliographic research work of [Salliou, 2011]4 and those at the beginning of the thesis of [Regard, 1996]5. In addition, the latter showed that the reported values range from \(C_{\text{d}}\) = 0.1 to \(C_{\text{d}}\) = 2, thus influencing the magnitude of the flow rate through the opening by 10% to 200%. However, it is difficult to overcome this uncertainty without a wind tunnel study (digital or real). Depending on the case, it will therefore be necessary to adapt the value of the Cd in order to stay within conservative hypotheses and interpret the results with care.
Pressure coefficients
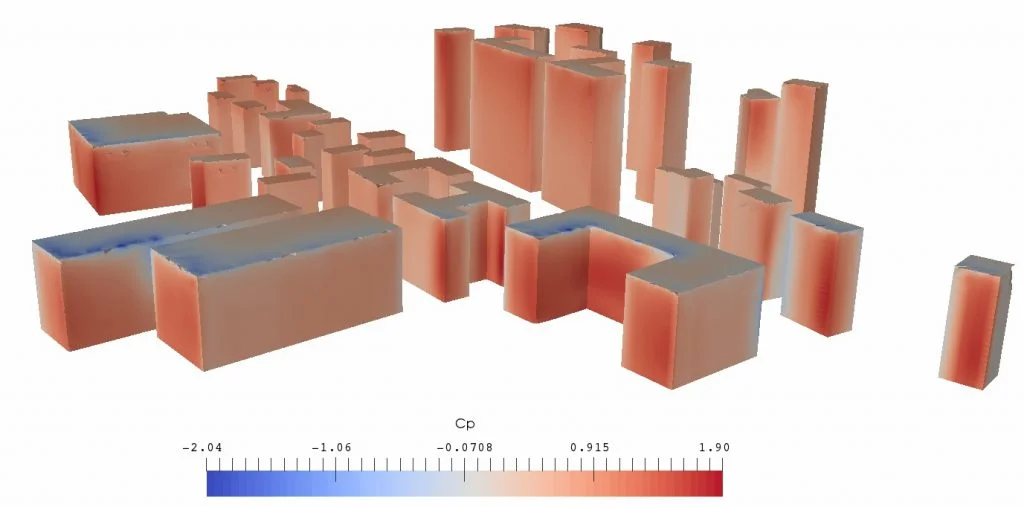
These are very variable according to the wind direction, its local speed on the facade, the shape of the building as well as the geometry of its near and far environment. On the same facade of a building with regular geometry, \(C_{\text{p}}\) also presents significant inhomogeneities. Figure 2 shows an example of the calculation of \(C_{\text{p}}\) in an urban environment where the pressure takes disparate values that can be positive and slightly negative at different locations on the same wall.
Reference air velocity
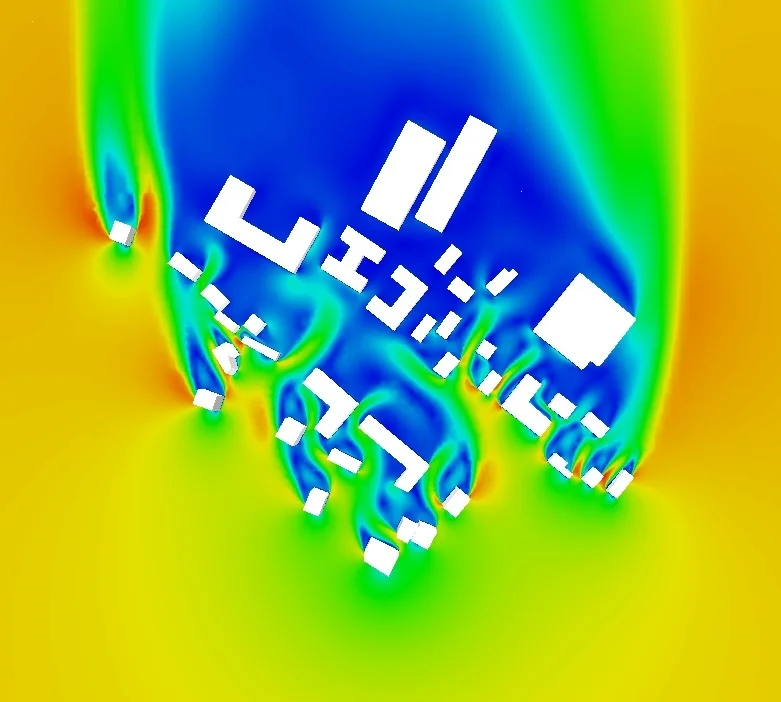
The velocity magnitude is taken as the air velocity of the weather station whose height and location are often unknown. It is therefore difficult to conclude as to the actual speed around the building, which depends on the topography, the distant and nearby urban environment and the associated roughness. Figure 3 shows an example of the complexity of flows in urban areas.
The reduction of the number of uncertain parameters therefore requires urban air flow simulation with open source or off the shelf commercial softwares solving the Reynolds averaged Navier Stokes equations as well as mass conservation (“RANS” approach), using for example a \(k-\epsilon\) turbulence model.
This approach makes it possible to explicitly calculate the facade \(C_{\text{p}}\) as a function of the annual wind rose and the urban environment, thus reducing uncertainty about velocities and pressure coefficient values. The simulation results are then to be fed into the yearly building energy simulation. It should be noted that only the effects of wind are considered in this approach: the thermal draft can be taken into account by a condition on Richardson’s number.
ASHRAE. Ventilation and Infiltration. HVAC Fundamentals Handbook, 492-519. Atlanta: ASHRAE Handbook Editor, 1997. PDF link ↩︎
Swami, M.V., et S. Chandra. Correlations for pressure distribution on buildings and calculation of natural-ventilation airflow. ASHRAE Transactions, 1988: 243-266. PDF link ↩︎
Akins, R.E., J.A. Peterka, et J.E. Cermak. Averaged Pressure Coefficients for Rectangular Buildings. Proceedings of the Fifth International Wind Engineering Conference. Fort Collins, 1979. 369-380. PDF link ↩︎
Regard, Muriel. Contribution à l’étude des mouvements d’air dans le bâtiment à l’aide d’un code de champ. Thèse de doctorat, Lyon: INSA, 1996. PDF link ↩︎
Salliou, Jean-Rémy. Analyse de l’influence de paramètres géométriques et physiques sur le coefficient de décharge appliqué à la ventilation dans le bâtiment. Thèse de Master Recherche, Nantes: Ecole Supérieure d’Architecture de Nantes, 2011. Direct access ↩︎